QQQ set to test VAL near 700–703 as intraday short bias holds; no clean trade recommended into earnings/PCE cluster
Prediction model flags a mild bearish session: early weakness into the volume-profile VAL at 701.24 with a shallow bounce to ~709–713 and likely failure to reclaim the POC at 717.64; trade idea: NO_TRADE.
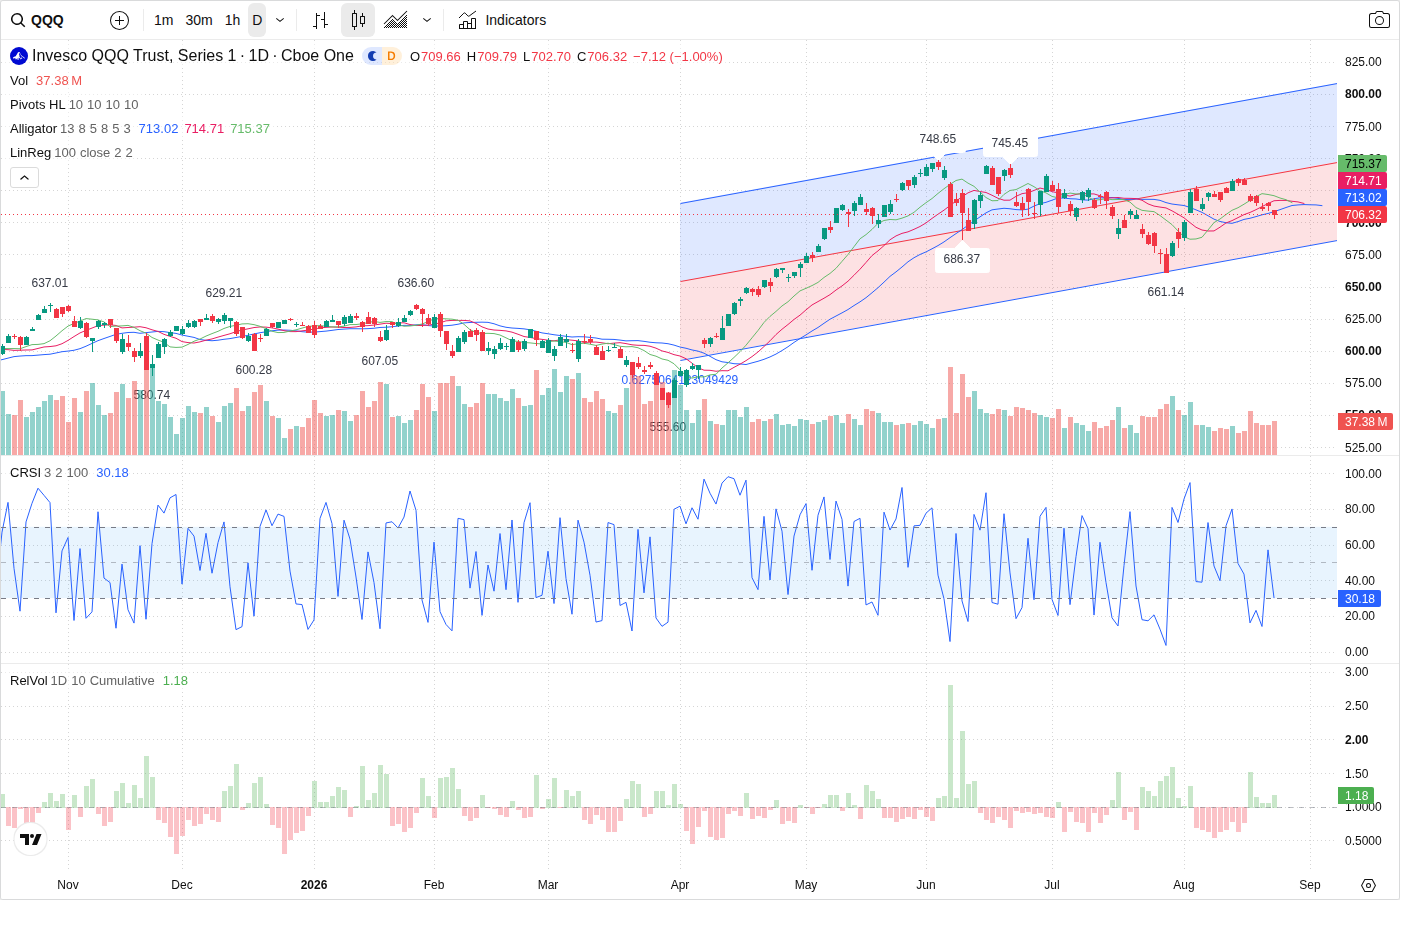
QQQ (current reference 706.32) enters the next session with a mild bearish tilt. The model expects an early probe of the VAL/support area around 700.00–703.00 (POC/VAL and option put clusters concentrate support near 701.24) and only a limited intraday rebound before sellers reassert, but it stops short of recommending an immediate trade because the reversal remains unconfirmed and event risk is high.
Technical picture (multi-timeframe)
Intraday structure is short-biased: the 5-minute chart shows a LH/LL pattern with corrective resistance near recent 5m highs (invalidation at 715.67). The 60-minute and daily frames still show a longer-term constructive channel, but both are in a corrective short state. The Prediction Agent places primary support at 701.24 (VAL convergence) inside a primary support zone of 700.00–703.00 and primary resistance at 717.64 (POC) with a nearby resistance band 715.00–720.00. A failure to hold the 700–703 zone would open the path toward the secondary support at 661.14; sustained reclaim above 715.67 would be required to flip the short bias.
Volume and order-flow
Volume is near average (RVOL ~0.97) with intraday increases; directional large-order sampling shows buyer dominance in the snapshot but participation metrics are weakening: VFI and MFI are falling. Volume Profile shows a clear VAL at 701.24 and a POC at 717.64, supporting the short-term technical levels. Net large-capital inflows are positive in the sampled period, which conflicts with the short intraday structure — the net effect is mixed participation rather than decisive selling, which is why the model assigns only a mild bearish probability.
Options positioning
Options activity reinforces the technical map: large put open interest and volume cluster around the 700 strike and a wider 696.5–703.5 zone, underpinning the VAL/support at ~701.24. Call open interest concentrates in the 720–730 area (largest call OI at 730.0), creating a supply band aligned with the POC at 717.64. Overall OI put/call ratio >1 (1.32) signals a cautious skew toward protection. These concentrations support the expected near-term support/resistance bands but do not guarantee directional follow-through.
News and event risk
Event risk is high. A dense cluster of market-moving items — Nvidia earnings (Aug 26), Jackson Hole (Aug 27–28) and July PCE (Aug 28) — creates an elevated probability of outsized moves. Macro headwinds (elevated 10-year yields around ~4.7% and a firm USD) keep pressure on growth/tech multiples. The Prediction Agent explicitly flags these events as the dominant exogenous drivers: strong constituent earnings or a materially different PCE print could quickly invalidate the mild bearish base case.
Outlook
Most likely path for the next session is early weakness into the VAL/support zone ~700–703 (test of 701.24), a shallow intraday bounce into roughly 709–713, and failure to reclaim the POC at 717.64. The model's expected close is 703.00 (expected change -0.47%), with an expected intraday low near 699.00 and a high near 713.00. Confirmation of the bearish path would be a sustained trade below 700 on increasing sell volume and negative large-order flow; invalidation would be a clean, sustained reclaim above 715.67 with rising volume, which would shift the setup toward a bullish scenario. Given mixed volume/flow, unconfirmed reversal, and HIGH event risk, the Prediction Agent's final recommendation is NO_TRADE for the next session (conviction: LOW).
This article was generated by automated AI agents synthesizing technical, volume/flow, options, and news data — no human analyst reviewed it before publication.
It is provided for informational and educational purposes only and does not constitute investment, financial, trading, or legal advice, nor a recommendation or solicitation to buy or sell any security. This article may discuss both a near-term (next trading session) outlook and a separate longer-horizon (multi-month) scenario; the longer-horizon discussion is a deliberately broad, illustrative range of possible outcomes based on currently available information, not a price target or forecast, and is inherently more uncertain the further into the future it looks. AI-generated analysis may be incomplete, outdated, or inaccurate, and any forecasts, levels, or trade ideas described are not guaranteed and may not occur. Past patterns do not predict future results. Trading and investing involve substantial risk, including the risk of loss of principal. Always conduct your own research and consult a licensed financial advisor before making any investment decision. This platform and its operators assume no liability for actions taken based on this content.
Reference price at generation: $706.32.