TSLA gaps to $362.86; model flags mild bullish follow-through but urges no new trade until 365 reclaim or 337.24 break
Intraday momentum from delivery beats and Cybercab speculation pushes Tesla into a near-term battleground between the 337–345 support band and 365–370 call wall.
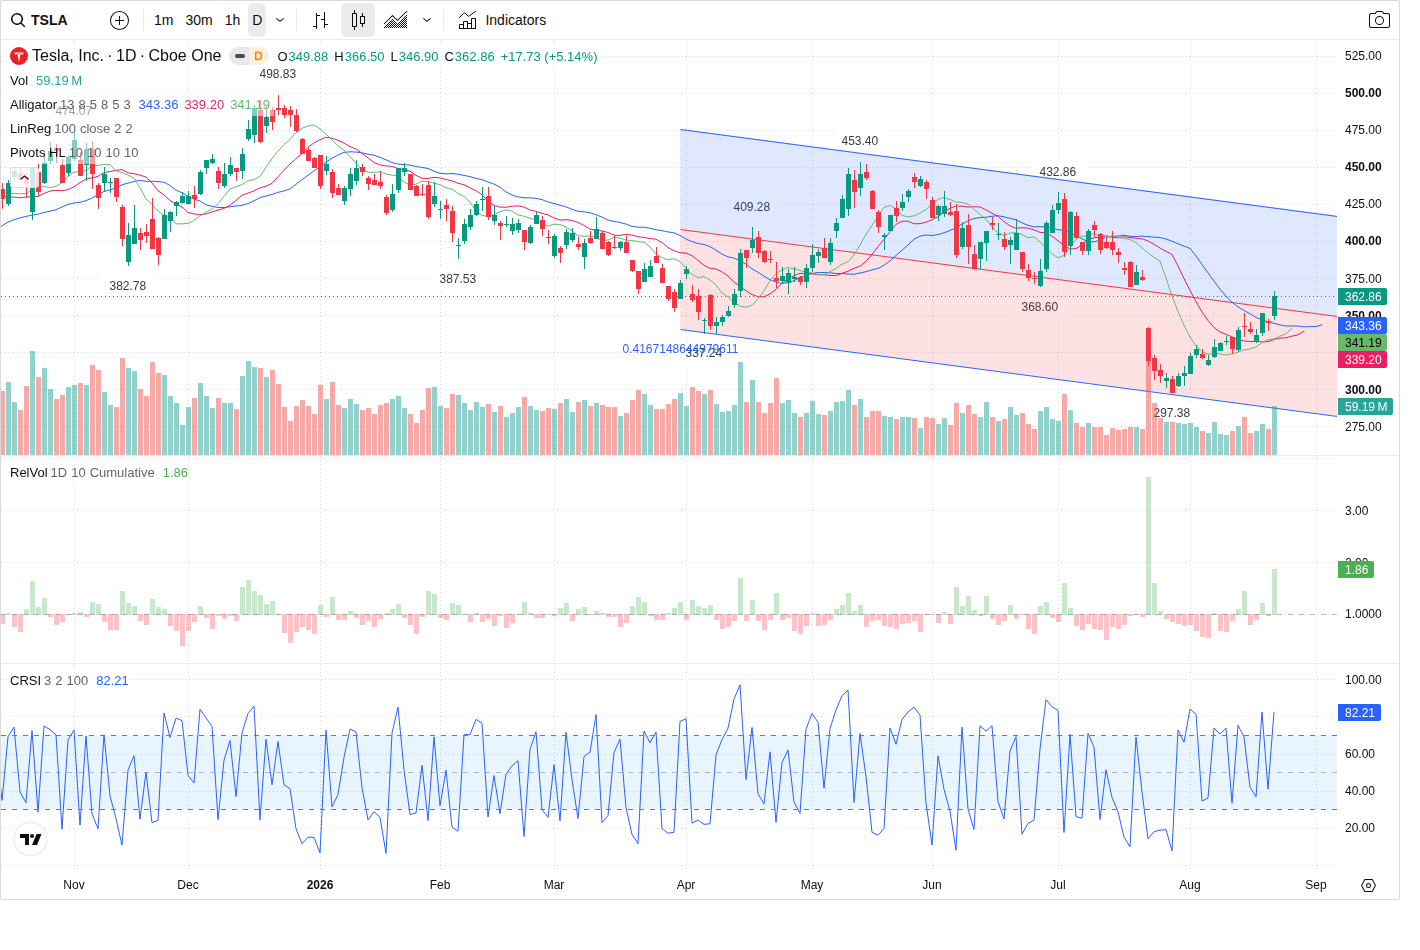
Tesla closed at $362.86 (+5.14%) after a gap higher; the prediction model sees a mild bullish bias for the next session (confidence 65) but recommends standing aside—no trade—until price either decisively reclaims 365.00 on rising volume or breaks below the 337.24 support zone.
Technical picture — multi‑timeframe conflict, clear battlegrounds
The prediction agent labels the next session MILD_BULLISH (65% confidence) with baseline probabilities: bullish 55%, range 25%, bearish 20%. Shorter timeframes favor buyers: 5m shows a HH/HL long structure and an intraday channel, while 60m and daily remain in broader corrective/short regimes. Primary support is the combined VAL/daily support cluster at 340.13 (zone 337.24–345.00). Near-term resistance is concentrated at 365.00 (zone 365.00–370.00) — the model identifies that strike cluster as the most likely seller defence. Secondary targets are 297.38 (support) and the volume POC around 398.15375 (resistance).
Volume and money flow — participation supports momentum but not full accumulation
Today’s RVOL spiked to ~1.73 on 57,059,660 shares vs recent averages, and intraday directional flow slightly favored buyers (buy_pct 50.34, imbalance 12,038 shares). MFI is bullish at 64.76 and rising, while VFI has improved (current -2.3469) but remains below zero, indicating participation without clear broad accumulation. Capital-flow data shows net positive large flows (net ~5,022,508), supporting the mild bullish tilt. The prediction agent reads this as supportive but insufficient to declare a confirmed reversal on higher timeframes.
Options positioning — call-heavy front-month creates resistance and fuel
Short-dated options are skewed toward calls: call/put volume and OI ratios favor calls (V PCR ~0.346, OI PCR ~0.164). Important strikes cluster at 350, 360, 365, 370 and 380 for the Aug 28 expiry. The model highlights heavy call volume/oi at 365/370 as the near-term resistance zone and notes that taking out those strikes on rising volume would remove a seller defence and could unlock a run toward the 398.15375 POC. Conversely, concentrated put OI near 338–341 helps support the 337–345 buyer zone.
News & macro context — deliveries and Cybercab speculation underpin the gap; macro is a headwind
Company news drove today’s gap: materially above‑consensus Q2 deliveries and media reports of a limited Cybercab/robotaxi trial in Austin near month‑end. The prediction agent calls the immediate news bias MILD_BULLISH but points to elevated macro headwinds — a ~4.7% 10‑yr yield and the Sep FOMC (Sep 15–16) plus early‑September jobs/CPI — which keep valuation risk elevated. Event risk is judged MEDIUM; the model expects the short‑term momentum to persist absent a higher‑impact macro release but flags the autonomy demo as a binary catalyst over the next days.
Outlook
Most likely path: early session tests of the 340.13 primary support zone (337.24–345.00) or VWAP, then a buyer recovery into the 365–370 option strike area. The model’s predicted close is roughly 368.00 (expected intraday high 375.00, low 340.13). Confirmation for a tradable bullish setup requires a sustained reclaim and intraday close above 365.00 on rising volume; bearish confirmation is a break and close below 337.24 with expanding selling volume. Given compressed reward vs. stop distance and unconfirmed higher‑timeframe reversal, the prediction agent’s trade idea is NO_TRADE (conviction LOW) until either of those confirmation events occurs.
This article was generated by automated AI agents synthesizing technical, volume/flow, options, and news data — no human analyst reviewed it before publication.
It is provided for informational and educational purposes only and does not constitute investment, financial, trading, or legal advice, nor a recommendation or solicitation to buy or sell any security. This article may discuss both a near-term (next trading session) outlook and a separate longer-horizon (multi-month) scenario; the longer-horizon discussion is a deliberately broad, illustrative range of possible outcomes based on currently available information, not a price target or forecast, and is inherently more uncertain the further into the future it looks. AI-generated analysis may be incomplete, outdated, or inaccurate, and any forecasts, levels, or trade ideas described are not guaranteed and may not occur. Past patterns do not predict future results. Trading and investing involve substantial risk, including the risk of loss of principal. Always conduct your own research and consult a licensed financial advisor before making any investment decision. This platform and its operators assume no liability for actions taken based on this content.
Reference price at generation: $362.86.