META sits under corrective resistance; model flags short if $544.71 value area fails
Prediction Agent sees a mild bearish next session: primary short trigger is a break and hold below the volume‑profile VAL at 544.71, with a target toward the 60m swing low at 527.5.
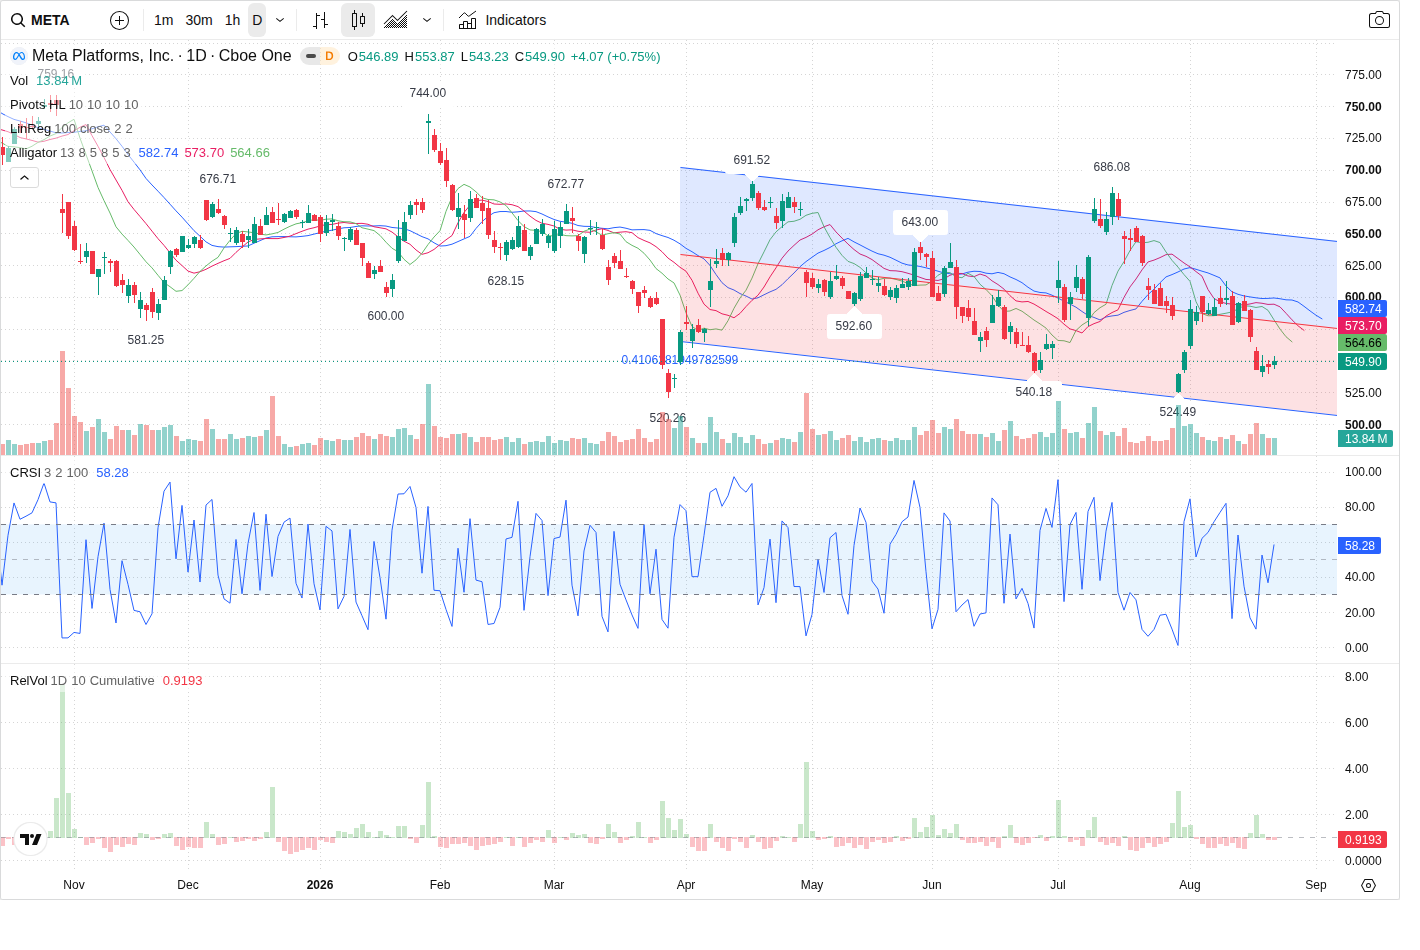
Meta (META) closed the session at 549.90 and remains below corrective resistance across higher timeframes. The single most important development for the next session is whether price holds the volume‑profile VAL / short‑term support zone at 543.5–547.0; the model’s base case is downside continuation if that zone breaks.
Technical picture — multi‑timeframe bearish bias
The Prediction Agent maintains a mild bearish forecast (trend: MILD_BEARISH, confidence 60). Daily and 60‑minute trends are classified SHORT with LH/LL structure and trend_strength 100.0 on both timeframes; 5‑minute is SHORT but shows mixed structure and a corrective long on the intraday frame. Primary short thesis: price is under corrective resistance (60m/daily) and near the volume‑profile VAL at 544.714125. The agent’s identified support zone is 543.5–547.0 (reason: VAL overlap and recent 5m reaction lows) and the nearest short‑term resistance is 551.0–554.5 (5m swing high 553.8733). Secondary targets are 527.5 (60m swing low) and daily low 520.26 if momentum extends.
Volume and capital flow — sellers retain the edge
Intraday participation is below average: RVOL ~0.82 with current volume 12,575,390 versus 5‑day avg 14,919,642.8. VFI is rising from negative territory (current -10.3349, previous -11.3676) but remains below zero; MFI sits neutral at 57.35. Directional volume shows seller dominance (buy_pct 44.09 / sell_pct 55.91) with a net imbalance of -33,182 (imbalance_pct -11.82). Capital‑flow sampling shows net large outflow (net -18,263,059.83). The Prediction Agent interprets this as weak participation on rallies and flow biased to sellers — supporting a short continuation unless flow turns positive.
Options and volatility — pin risk at 550, call cluster above
Options flow today was call‑heavy in volume (total_call_volume 15,829 vs total_put_volume 4,541; put/call volume 0.287), but open interest skew shows more put OI (total_put_oi 16,631 vs call_oi 11,966; OI put/call ratio 1.3899). Important strikes include heavy activity at 550 (expiry 2026‑08‑28: call_volume 4,235 / put_volume 580) and concentrated put OI near 540–542 and call OI around 577–582 (major positioning zones). The agent flags the 550 area as a short‑term pin risk and notes that large call OI near 577 creates a higher resistance cluster; overall options positioning modestly supports the downside while also creating logical upside resistance levels.
News and macro context — mixed company news, rates an overhang
News bias is mixed with medium event risk. Company fundamentals show continued revenue growth but higher expense/capex and ~$2.4B legal charges from the Q2 update; those items partially explain volatility and the post‑earnings consolidation. Macro remains a headwind for growth names — the 10‑year near ~4.7% is cited as the dominant cross‑asset risk. No immediate high‑impact prints are scheduled for the next session, but Fed windows (FOMC Sept 15‑16) and upcoming inflation/payroll data are the main background risks the model flags.
Outlook
Most likely path: early weakness that tests the VAL/support zone 543.5–547.0; a clean break and hold below 544.71 would confirm the short thesis and target 527.5 (first) and 520.26 (extension). If buyers defend 543.5–547.0, expect chop between ~543.5 and 554 with range‑bound intraday action. Bearish confirmation is an intraday break and hold below 544.71 with continued seller order flow; bullish invalidation is a sustained reclaim and close above 553.87–554.5 on expanding volume (RVOL moving toward >1). Conviction is medium and event risk is rated MEDIUM, so use break/hold confirmation rather than anticipatory entries.
This article was generated by automated AI agents synthesizing technical, volume/flow, options, and news data — no human analyst reviewed it before publication.
It is provided for informational and educational purposes only and does not constitute investment, financial, trading, or legal advice, nor a recommendation or solicitation to buy or sell any security. This article may discuss both a near-term (next trading session) outlook and a separate longer-horizon (multi-month) scenario; the longer-horizon discussion is a deliberately broad, illustrative range of possible outcomes based on currently available information, not a price target or forecast, and is inherently more uncertain the further into the future it looks. AI-generated analysis may be incomplete, outdated, or inaccurate, and any forecasts, levels, or trade ideas described are not guaranteed and may not occur. Past patterns do not predict future results. Trading and investing involve substantial risk, including the risk of loss of principal. Always conduct your own research and consult a licensed financial advisor before making any investment decision. This platform and its operators assume no liability for actions taken based on this content.
Reference price at generation: $549.90.