NVDA drifts into volume‑profile POC (208.385) as pre‑earnings pullback adds short bias for next session
Model flags a mild bearish next session: highest-probability path is further weakness to the 208.4–214.58 POC/VAH zone ahead of earnings and Jackson Hole speeches.
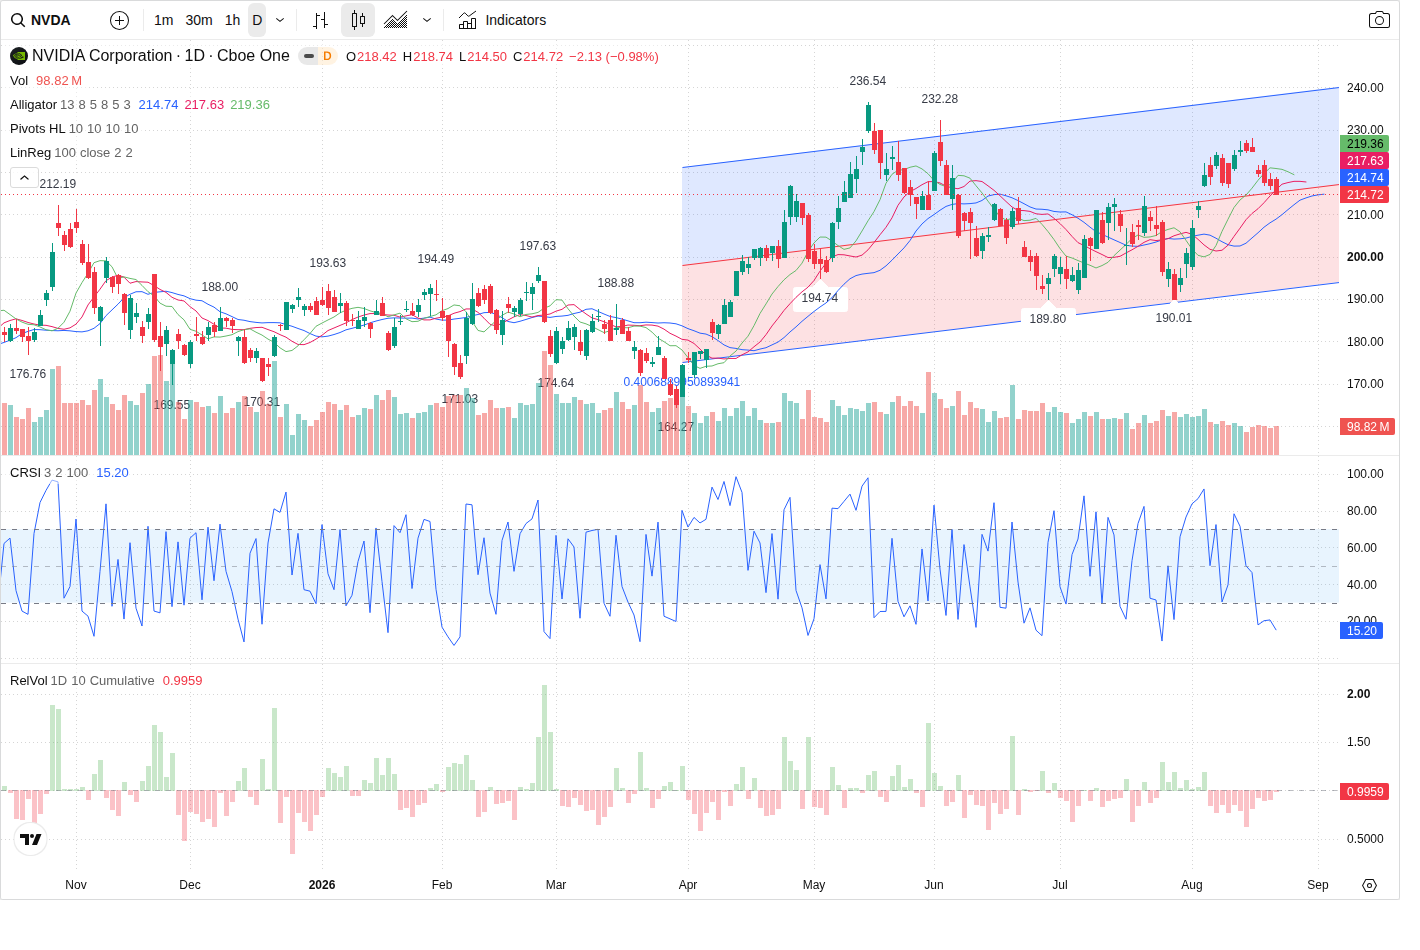
NVIDIA (NVDA) closed the session at 214.72 after a modest intraday pullback (-0.982%), leaving price trading inside a short-term 5‑minute down channel and squarely within the volume‑profile value area. The Prediction Agent assigns a mild bearish bias for the next session, with the most likely move a test of the volume‑profile point of control at 208.385.
Technical picture — multi‑timeframe conflict
Shorter intraday structure is decisively bearish: the 5‑minute shows LH/LL with a corrective down‑channel and corrective resistance around recent 5m highs (nearest resistance noted at 218.74). At the same time, the 60‑minute and daily trends remain structurally long (both flagged LONG, trend_strength 100.0) and price is still inside the daily up‑channel. The prediction identifies the primary near‑term support zone as the VAH/POC band 208.00–214.58 (POC = 208.385; VAH ≈ 214.58) and primary resistance 215.00–224.00 (with option activity clustered near 220.00/230.00). The reversal setup (BEARISH_PULLBACK_REVERSAL) is flagged but not confirmed — that lack of confirmation drives the model’s caution.
Volume, order flow and participation
Relative volume is subdued (RVOL ≈ 0.83) even as sellers dominated on the session: directional data show buy_volume 1,586,434 vs sell_volume 10,518,179 (imbalance -8,931,745; sellers 86.89% of flow). VFI is rising and above zero (current 0.633 from 0.453), while MFI remains in a bullish band though off recent highs (current 60.24, previous 67.27). The net capital flow sample shows large‑cap outflows materially exceeding inflows (net ≈ -1,917,872,576), consistent with distribution into the pullback. The Prediction Agent therefore reads the volume picture as sell‑dominated but lacking the expanding RVOL that would confirm an immediate momentum acceleration lower.
Options positioning
Short‑dated options concentrate call volume and OI above spot: heavy call volume at 220.00 (47,082 call volume) and the largest call OI at 230.00. Put activity is prominent lower, with the largest put OI at 190.00 and notable put volume at 200.00. The model identifies the 215.00–224.00 band as option‑reinforced resistance (calls clustered at 220/225), while meaningful put OI near 190.00 forms a longer‑term downside anchor. Overall OI skew is modestly call‑heavy, but the immediate effect is more resistance into the 220 area than protection above current price.
News & macro — event risk dominates
Event risk is high: NVIDIA’s fiscal Q2 earnings and conference call are scheduled for Aug 27, 2026, coinciding with the Jackson Hole central bank symposium (Aug 27–29). The news packet flags hard event risk and rates remain a headwind (10‑year yields around ~4.6–4.7%), increasing sensitivity for high‑multiple names. The Prediction Agent rates next‑session bias as mild bearish and notes price has likely priced in some positioning ahead of the print — the pullback is consistent with profit‑taking and elevated positioning risk rather than a confirmed structural reversal.
Outlook
The most likely path for the next session is opening weakness and a probe of the volume‑profile POC/VAH zone near 214–208 (expected_intraday_low ~208.5; expected_close 211.0). Bullish confirmation would require a sustained reclaim above 217.50 on rising RVOL and improving large‑order inflow; bearish confirmation would be a break and hold below the POC (~208.385) on expanding sell volume, which would open a route toward the 60m/daily intermediate support at 190.01. Given the unconfirmed reversal and high event risk, the Prediction Agent recommends NO_TRADE until one of those confirmations occurs.
This article was generated by automated AI agents synthesizing technical, volume/flow, options, and news data — no human analyst reviewed it before publication.
It is provided for informational and educational purposes only and does not constitute investment, financial, trading, or legal advice, nor a recommendation or solicitation to buy or sell any security. This article may discuss both a near-term (next trading session) outlook and a separate longer-horizon (multi-month) scenario; the longer-horizon discussion is a deliberately broad, illustrative range of possible outcomes based on currently available information, not a price target or forecast, and is inherently more uncertain the further into the future it looks. AI-generated analysis may be incomplete, outdated, or inaccurate, and any forecasts, levels, or trade ideas described are not guaranteed and may not occur. Past patterns do not predict future results. Trading and investing involve substantial risk, including the risk of loss of principal. Always conduct your own research and consult a licensed financial advisor before making any investment decision. This platform and its operators assume no liability for actions taken based on this content.
Reference price at generation: $214.72.