TSLA rests on a converging 337–341 support band as options call cluster pins resistance near 350–352
Model sees a mild bullish bias into the next session but recommends no trade until a clear breakout above 351.62 or breakdown below 337.24 confirms direction.
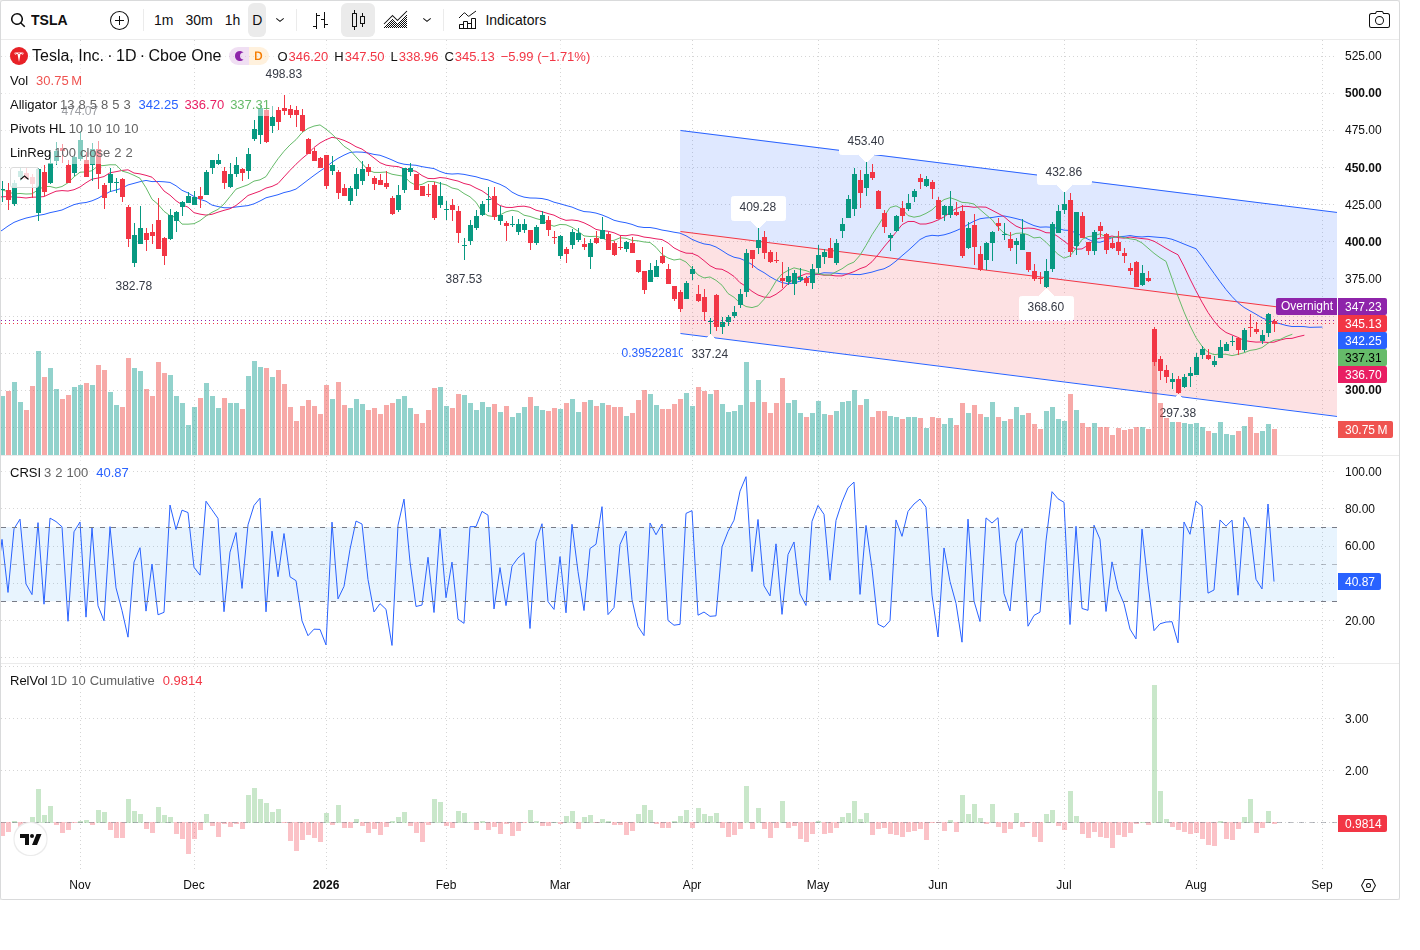
Tesla shares are trading around 345.13 after a -1.706% session decline and sit a few points above a multi-timeframe support cluster at 337.24–341.00. The prediction model expects an intraday test of that zone with a mild recovery toward the 350.00–352.00 call-concentration band, but does not find a high-confidence trade entry for the next session.
Technical picture — mixed timeframes, short‑term edge to buyers
The short-term structure is constructive: the 5-minute timeframe shows HH/HL and an active corrective channel with price above the 5m corrective support and a nearest support at 338.96. By contrast the 60-minute and daily trends remain SHORT on their timeframes, leaving the larger trend unresolved. The Prediction Agent identifies a primary support zone at 338.96 (clustered with the daily swing low 337.24 and the volume-profile VAL ~340.61) and immediate resistance at 351.62 (options and recent intraday highs concentrate supply in the 350.00–352.00 band). A confirmed reclaim and sustained trade above 351.62 is the stated bullish confirmation; a drop and close below 337.24 on rising selling volume would confirm the bearish case.
Volume and order flow — buyers present but participation is moderate
Intraday relative volume (RVOL) sits below average (~0.76) while VFI is negative but rising and MFI remains in bullish territory (current 62.486 after a pullback). Directional flow points to buyer dominance: buy_pct ~59.83 with an imbalance of 136,778 shares (19.67%). Capital‑flow metrics show net large‑ticket inflows (large net ~47,695,089). Taken together this supports the model’s view that buyers can defend the 337–341 band, but the below‑average RVOL and lack of overwhelming volume confirmation keep conviction moderate.
Options and volatility — call supply concentrates near 350
Options positioning strengthens resistance around 350: largest call OI and call volume sit at the 350 strike for the Aug 28 expiry, and the model flags a call OI concentration zone 348.25–351.75. Put OI clusters appear nearer 335 (put zone 333.325–336.675), creating two nearby positioning bands that can act as short‑dated magnet/supply. Implied volatility is ~0.403 with realized volatility lower (~0.3455), so IV sits above HV (IV/HV ratio ~1.166) but not at extreme levels—enough to make the 350 area sticky on failed breakouts.
News and macro — mixed headlines; medium event risk ahead
The news backdrop is mixed and the model assigns MEDIUM event risk, citing macro catalysts—most notably PCE on Aug 26, ongoing Treasury coupon auctions and Fed commentary—that can move rates and market tone for growth names like TSLA. Company‑specific items are background risk (regulatory disclosures), with no imminent earnings or material corporate event in the immediate 2–10 day window. The combination of macro uncertainty and concentrated call supply supports the model’s cautious stance.
Outlook
Most likely path (45%): early‑session probes into the 337.24–341.00 support cluster (possible brief low to ~338.5) that buyers defend, producing a recovery toward 350.00–352.00; a sustained trade/close above 351.62 with rising volume would validate a bullish follow‑through toward the 360.00 secondary target. Alternate outcomes: rangebound chop between ~337–352 (30%) or a failure of support and a move toward the secondary support at 330.00 (25%). Given the unresolved higher‑timeframe bearish bias, below‑average intraday participation and concentrated options call supply at 350–352, the Prediction Agent issues NO_TRADE for the next session until either a confirmed reclaim above 351.62 or a decisive break below 337.24 occurs.
This article was generated by automated AI agents synthesizing technical, volume/flow, options, and news data — no human analyst reviewed it before publication.
It is provided for informational and educational purposes only and does not constitute investment, financial, trading, or legal advice, nor a recommendation or solicitation to buy or sell any security. This article may discuss both a near-term (next trading session) outlook and a separate longer-horizon (multi-month) scenario; the longer-horizon discussion is a deliberately broad, illustrative range of possible outcomes based on currently available information, not a price target or forecast, and is inherently more uncertain the further into the future it looks. AI-generated analysis may be incomplete, outdated, or inaccurate, and any forecasts, levels, or trade ideas described are not guaranteed and may not occur. Past patterns do not predict future results. Trading and investing involve substantial risk, including the risk of loss of principal. Always conduct your own research and consult a licensed financial advisor before making any investment decision. This platform and its operators assume no liability for actions taken based on this content.
Reference price at generation: $345.13.