MSFT eyeing intraday test of 479.5 after 5‑min LH/LL; reversal unconfirmed, model advises no trade
Prediction model sees a mild bearish next session: early weakness into 479.5 is the highest-probability path, but conflicting volume and options evidence leave conviction low and the recommendation is NO_TRADE.
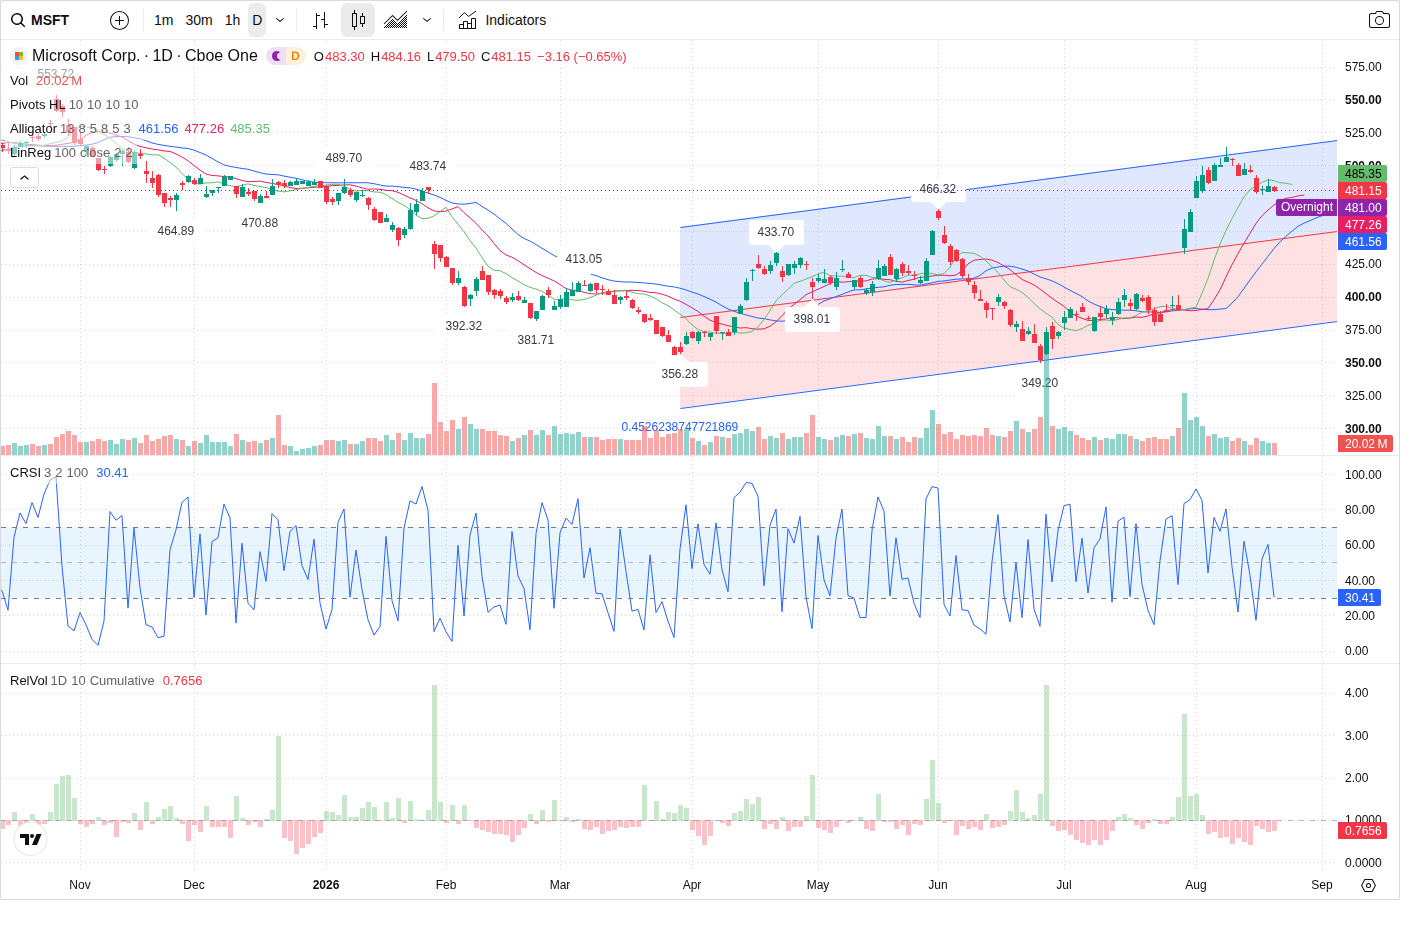
Microsoft (MSFT) is trading at 481.15 in premarket, sitting between a 5‑minute corrective resistance and a recent swing low. The model’s highest‑probability outcome for the next session is an early test of primary support at 479.5, but the reversal remains unconfirmed and participation is light — so the systematic call for the session is cautious.
Technical picture — short intraday bias, higher‑timeframe nuance
Intraday structure is short: the 5‑minute timeframe shows an LH_LL pattern with price described as “at_corrective_resistance” and the nearest swing low at 479.5 (invalidation on the 5m at 489.29). The Prediction Agent calls the next‑session trend MILD_BEARISH with a 65% confidence level and assigns probabilities: bearish 45%, range 30%, bullish 25%. On the 60‑minute chart the intermediate trend remains LONG but in a corrective short phase, with price sitting near the lower edge of the 60m corrective channel. The daily picture is labelled SHORT/correction_active; daily invalidation is the 553.72 level. Key intraday levels to watch are primary support 479.5 (zone 479.0–481.0) and primary resistance 489.29 (zone 488.0–491.0).
Volume and capital flow — light participation but large‑money inflows
Overall participation is muted: RVOL is ~0.47 (current volume 15,519,129 vs 5‑day average 18,097,234) and volume trend is decreasing. That weak participation undermines a clean short setup. Offsetting that, VFI is rising (current 6.81) and directional large-order flow shows net-buyers (imbalance 55,291, buy_pct 55.65%), while capital‑flow samples show meaningful large‑size net inflows (large net ~27,657,602.58). The Prediction Agent flags this as conflicting evidence — volume is light, but institutional/large flows are net inflows — which is why conviction is low for directional trades.
Options positioning — put concentrations provide nearby downside interest
Options positioning creates nearby structural zones: the model highlights a put OI concentration at the 475 strike (largest put OI, large put volume at 475 and heavy put OI at 475/472.6–477.4 zone). Call interest clusters include a large call OI zone around 462.675–467.325 and call volume concentrated at the 500 strike (largest call volume). The Prediction Agent notes that if selling accelerates through 479.5 the put‑OI band ~472.6–477.4 becomes a logical next leg; conversely a decisive break above ~490 encounters call concentration and short‑covering risk toward 500.
News and macro context — rate sensitivity keeps near‑term risk elevated
Fundamentals remain constructive for Microsoft (Azure/AI momentum and positive FY2026 results), but macro variables dominate near term. Treasury yields have backed up and the July FOMC minutes signalled officials remain open to further hikes; the model lists medium event risk from upcoming US prints (Q2 GDP revision, Durable Goods, and PCE on Aug 27–28). The prediction’s next_session_bias is MILD_BEARISH — macro shocks that re‑accelerate inflation or push yields higher would increase downside risk, while neutral/calm macro prints would allow the stock to chop or re‑absorb flows.
Outlook
Most likely path: early weakness into the primary support zone 479.0–481.0 with a test of 479.5. If buyers defend there price should chop and may attempt a modest reclaim into the 485–489 area; a sustained reclaim above 485 on higher volume would validate bullish confirmation. Bearish confirmation is a break and hold below 479.0 on accelerating selling volume, which would point toward the put‑OI band ~472.6–477.4. Given the unconfirmed reversal, low RVOL and mixed capital‑flow/options signals, the Prediction Agent’s trade idea is NO_TRADE (conviction LOW) — wait for the explicit confirmations (reclaim 485 with rising volume or break/hold below 479.0 with accelerating RVOL) before taking directional risk.
This article was generated by automated AI agents synthesizing technical, volume/flow, options, and news data — no human analyst reviewed it before publication.
It is provided for informational and educational purposes only and does not constitute investment, financial, trading, or legal advice, nor a recommendation or solicitation to buy or sell any security. This article may discuss both a near-term (next trading session) outlook and a separate longer-horizon (multi-month) scenario; the longer-horizon discussion is a deliberately broad, illustrative range of possible outcomes based on currently available information, not a price target or forecast, and is inherently more uncertain the further into the future it looks. AI-generated analysis may be incomplete, outdated, or inaccurate, and any forecasts, levels, or trade ideas described are not guaranteed and may not occur. Past patterns do not predict future results. Trading and investing involve substantial risk, including the risk of loss of principal. Always conduct your own research and consult a licensed financial advisor before making any investment decision. This platform and its operators assume no liability for actions taken based on this content.
Reference price at generation: $481.15.