NVDA primed for a short-term pullback into 215.66 support as options OI packs resistance above 220–223
Model flags a mild bearish bias for the next session: intraday structure favors weakness toward the 215.66 cluster with limited volume confirmation and earnings next week keeping conviction low.
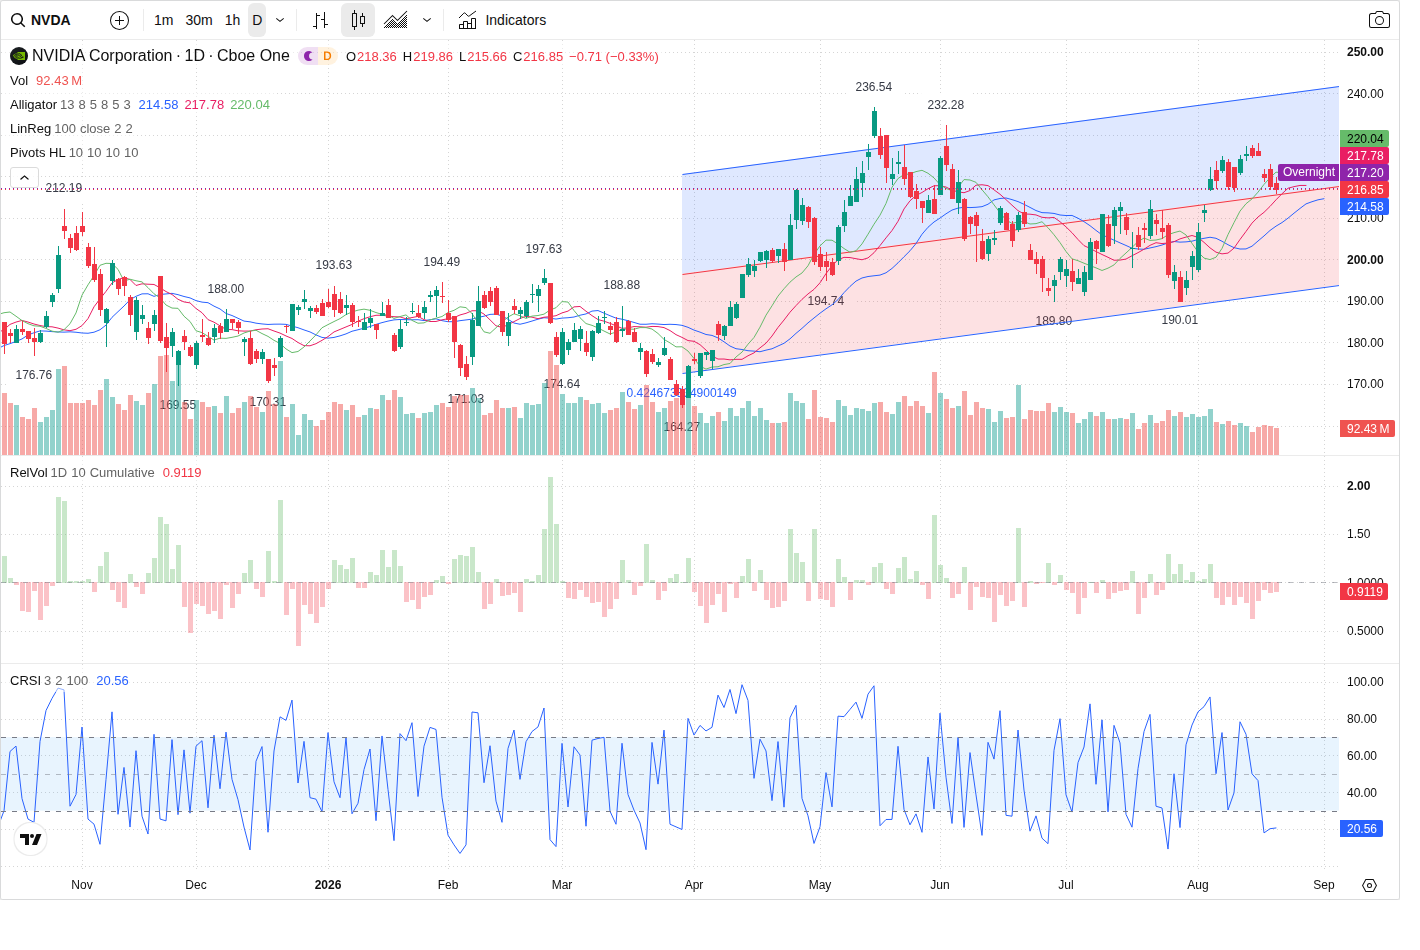
NVIDIA (NVDA) trades around 216.85 premarket, sitting just above an intraday support cluster at 215.66. The prediction model sees the highest-probability path as additional short-term weakness into that support, with a likely retrace capped near the 220.7–222.9 supply band if buyers step in — but no new directional trade is recommended ahead of earnings.
Technical picture — short-term down, longer timeframes still constructive
Intraday structure is decisively bearish: the 5-minute frame shows a LH/LL sequence inside a descending channel with price currently 'approaching_entry_zone' and a 5m invalidation at 222.87. The 60-minute and daily charts retain longer-term bullish structure (HH/HL on 60m and daily up channel), so the model views the current move as a corrective leg inside an overall uptrend. Primary near-term support is the 215.66 cluster (zone low 214.58–216.00); secondary support is the volume POC at 208.385. Nearest resistance and the 5m swing high sit at 222.87 (resistance zone 220.75–223.5).
Volume and order flow — selling dominates but participation is light
Relative volume is below average (RVOL ~0.70) and daily volume trend is decreasing. Directional prints show heavy seller dominance on recent ticks (buy_pct ~14%, sell_pct ~86%) and large-order capital flow registers net outflow — signs of distribution on rallies. VFI remains above zero and MFI is in bullish range, but both show fading strength. The Prediction Agent points out this combination: price bias is toward the downside, but weak volume participation reduces conviction for a persistent move.
Options and event context — call clustering above price, earnings increase volatility
Short-dated options concentrate call open interest around 225 and 230 (largest call OI strikes 225/230) and call-heavy volume at 230 (largest call volume strike). That positioning, together with IV near 52.85% and an options-implied move of roughly ~7% into earnings, creates asymmetric supply above current levels and a natural resistance band in the 220.8–223.5 area. Company earnings are a high-impact event (fiscal Q2 FY2027 after the close Aug 26); the Prediction Agent flags event_risk as HIGH and notes earnings guidance could trigger outsized moves and whipsaw behavior.
Session trade plan — scenarios and why the model recommends no new trade
The model’s probabilities for the next session are 45% bearish, 30% range, 25% bullish with prediction_confidence 62. The most likely path is early weakness toward 215.66, then either a hold and retracement back to 220.7–222.9 or a breakdown to the POC near 208.385 if 215.66 fails. Bullish confirmation is defined as a sustained close >222.87 on above-average buy volume; bearish confirmation is a decisive close below 215.50 on expanding sell volume. Despite a mild bearish tilt, trade_idea.direction is NO_TRADE: the reversal is unconfirmed, RVOL is subpar, seller flow dominates, and earnings-driven volatility raises the risk of false breakouts — conditions the model says make taking a new directional position inadvisable.
Outlook
Expect the next session to test the 215.66 support cluster first. If that level holds, intraday retracement toward the 220.7–222.9 resistance band is the most likely follow-through; a clean close below 215.50 on expanding sell volume would open a move toward the 208.385 POC. Because volume is light and earnings on Aug 26 present high event risk, a confirmed directional trade requires either a sustained reclaim above 222.87 with increased buy flow (bullish) or a decisive breakdown below 215.50 (bearish). Until one of those confirmations arrives the model recommends standing aside.
This article was generated by automated AI agents synthesizing technical, volume/flow, options, and news data — no human analyst reviewed it before publication.
It is provided for informational and educational purposes only and does not constitute investment, financial, trading, or legal advice, nor a recommendation or solicitation to buy or sell any security. This article may discuss both a near-term (next trading session) outlook and a separate longer-horizon (multi-month) scenario; the longer-horizon discussion is a deliberately broad, illustrative range of possible outcomes based on currently available information, not a price target or forecast, and is inherently more uncertain the further into the future it looks. AI-generated analysis may be incomplete, outdated, or inaccurate, and any forecasts, levels, or trade ideas described are not guaranteed and may not occur. Past patterns do not predict future results. Trading and investing involve substantial risk, including the risk of loss of principal. Always conduct your own research and consult a licensed financial advisor before making any investment decision. This platform and its operators assume no liability for actions taken based on this content.
Reference price at generation: $216.85.