C: Short-bias into CPI — model flags a test of 129.42–131.20 after intraday breakdown
Prediction model sees a mild bearish next session for Citigroup (C): short-term sellers dominant, target ~130.6 with stop/invalid at sustained reclaim above 137.6; US CPI is the key event risk.
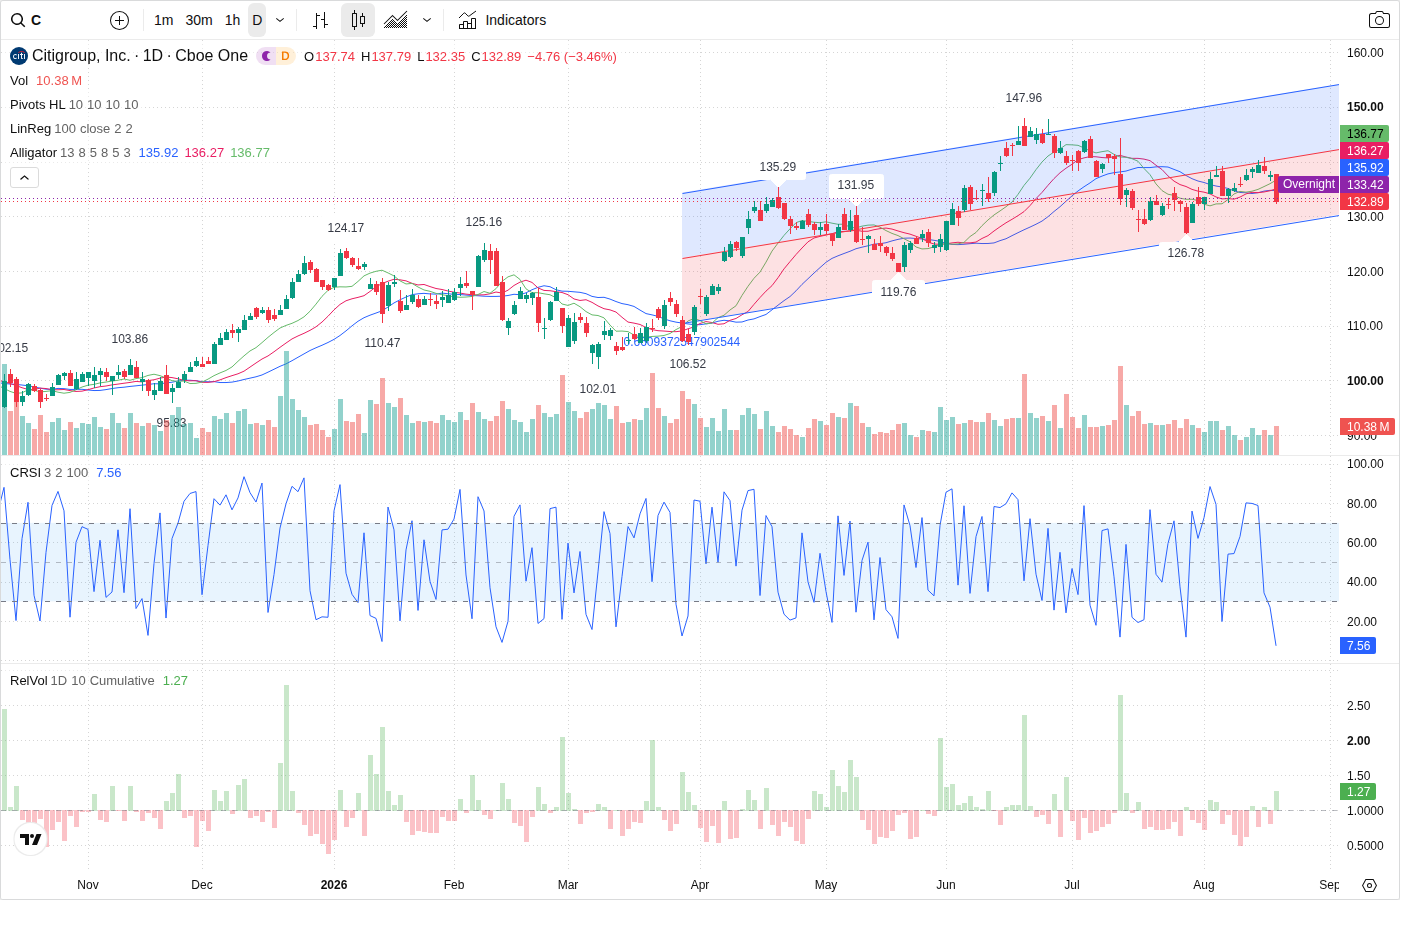
Citigroup opened the premarket under pressure after an intraday drop to 132.89 (≈-3.458% vs. prior close). The Prediction Agent rates the next session MILD_BEARISH (60% confidence) and expects an early test of the primary support zone 129.42–131.20, target ~130.6, with CPI prints at 08:30 ET the dominant catalyst.
Technical picture — short in the very short term, longer timeframes corrective
The agent’s multi-timeframe view is mixed: 5-minute structure is decisively short (LH_LL) and labelled correction_active, while 60-minute and daily trends remain structurally long but are in short corrective phases. The model’s primary support zone is 129.42–131.20 (reference price target ~130.6) — derived from the daily lower-channel / trendline (~130.57), volume-profile VAL/HVN clustering (VAL 129.42, POC 133.02) and 60m structure. Primary resistance is 134.50–137.00 (key rejection area), with a secondary resistance at 140.0 (large call OI concentration). Invalidation for the short view is a sustained close above 137.6, and a clean push above 140 would fully invalidate the bearish thesis.
Volume & order flow — selling dominance
Volume activity supports the short bias: intraday RVOL is ~1.28 with rising absolute volume on the decline (current volume 8,163,720 vs. 5d avg 5,381,534.4). Directional flow is skewed to sellers (buy_pct 29.89, sell_pct 70.11, imbalance -99,579), and the model notes VFI is above zero but falling. Capital-flow data shows significant large-order net outflows (large net -13,611,045.98), consistent with short-term distribution and a lower probability of a sustained rally absent fresh inflows.
Options positioning and volatility — a 130–140 corridor
Short-dated options concentrate positioning inside a 130–140 corridor. The model highlights large put OI at 130 and large call OI at 140 (notably 140 call OI 12,717 for Aug 21; 130 put OI 8,184 for Aug 21), reinforcing the 129–140 band as intraday interest. Implied vol (IV 0.3143) sits modestly above realized vol (HV 0.2945, IV/HV 1.067), so event-driven moves around CPI could widen IV; current put/call volume is light, meaning OI concentrations may act as magnet/barriers rather than immediate directional fuel.
News & event risk — CPI is the trigger
There are no fresh Citi-specific shocks; Q2 fundamentals (buybacks, ROTCE guidance) remain supportive medium-term. The immediate market driver is US CPI (Jul) at 08:30 ET — the agent tags event_risk as MEDIUM. The macro backdrop (elevated Treasury yields) supports a medium-term NII case for banks but increases sensitivity to CPI surprises; the model therefore treats the next session as event-driven with higher intraday volatility potential.
Outlook
Most likely next-session path: price opens under selling pressure, tests the primary support zone 129.42–131.20 with the model’s expected close ~130.0 (≈-2.18% predicted move) and an expected intraday low around 127.5. If support holds, a bounce back toward 135.0 is likely but capped by sellers; failure to hold below 129.4 on expanding selling volume would confirm continuation to the secondary support at 126.78. A sustained reclaim and close above 137.6 with rising buyer volume would invalidate the short bias and shift the setup toward bullish scenarios.
This article was generated by automated AI agents synthesizing technical, volume/flow, options, and news data — no human analyst reviewed it before publication.
It is provided for informational and educational purposes only and does not constitute investment, financial, trading, or legal advice, nor a recommendation or solicitation to buy or sell any security. This article may discuss both a near-term (next trading session) outlook and a separate longer-horizon (multi-month) scenario; the longer-horizon discussion is a deliberately broad, illustrative range of possible outcomes based on currently available information, not a price target or forecast, and is inherently more uncertain the further into the future it looks. AI-generated analysis may be incomplete, outdated, or inaccurate, and any forecasts, levels, or trade ideas described are not guaranteed and may not occur. Past patterns do not predict future results. Trading and investing involve substantial risk, including the risk of loss of principal. Always conduct your own research and consult a licensed financial advisor before making any investment decision. This platform and its operators assume no liability for actions taken based on this content.
Reference price at generation: $132.89.