Meta set to test 540 support zone after intraday corrective bounce; no trade recommended at open
Model sees a mild bearish edge into the next session with a likely probe of 537–543; a break would target the 527.5 swing low while reclaim above 556 would flip the view.
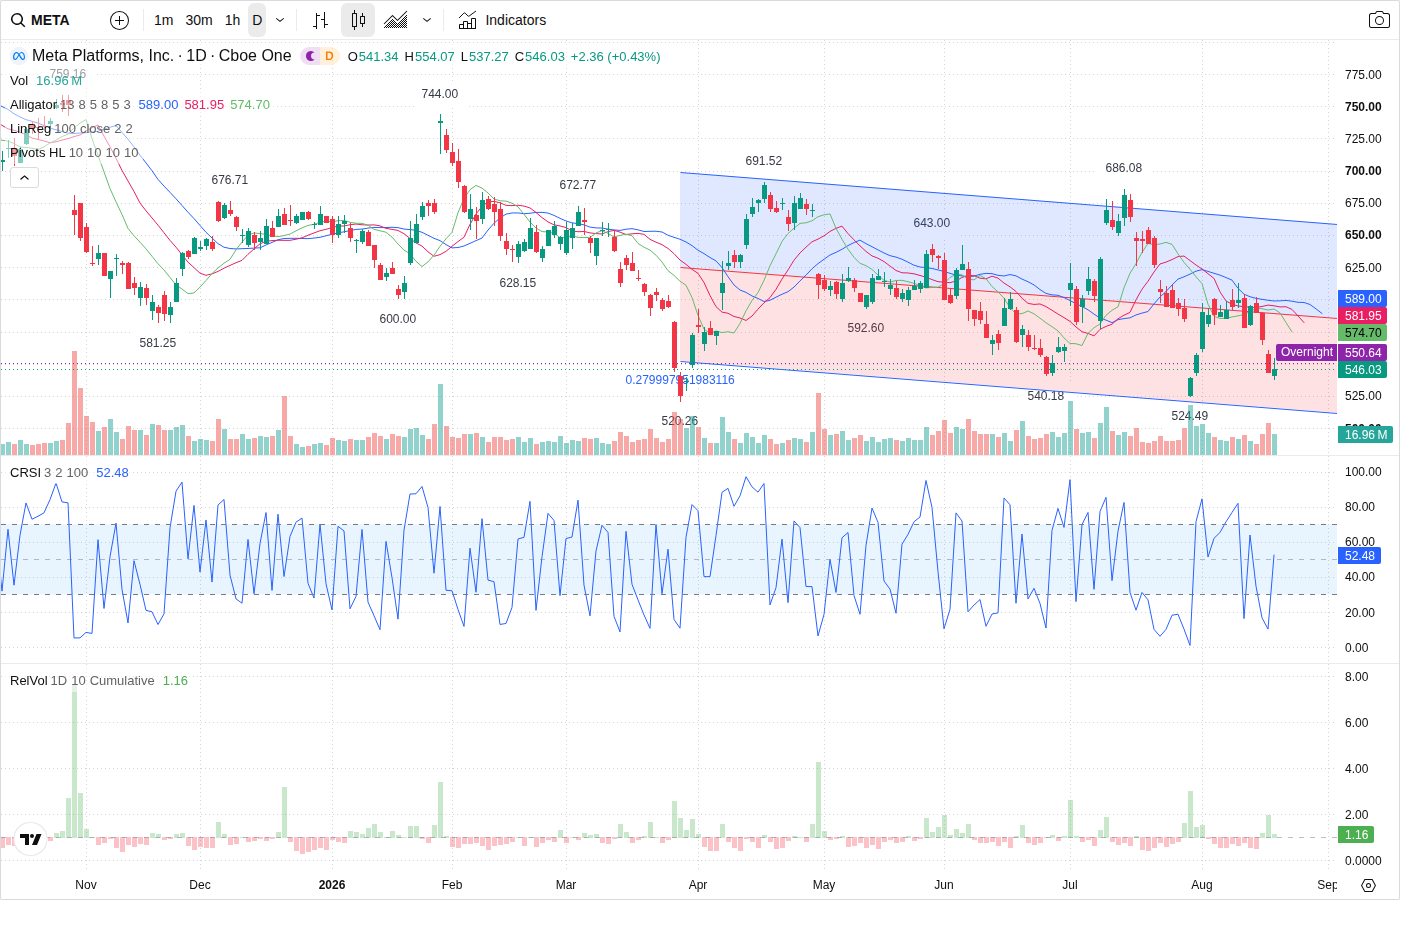
Meta (META) is trading near 546.03 in premarket action and sits immediately above a clustered short-term support zone at 537.0–543.0. The prediction model's next-session call is mildly bearish: expect an early test of the 540 area, with failure opening the path toward the 527.5 60‑minute swing low; the agent does not recommend initiating a trade at market open.
Technical picture — consistent short bias across timeframes
All monitored timeframes carry a dominant short bias: the 5‑minute and daily structures are LH/LL, and the 60‑minute trend is also short with a correction active. The model rates the next session as MILD_BEARISH with probabilities of 25% bullish, 30% range, and 45% bearish. Primary support is the 540.00 zone (zone low 537.0 / zone high 543.0); nearest supply sits at 550.5 (zone 549.0–556.0). Secondary levels cited are 527.5 (support) and 568.0 (secondary resistance). The predicted intraday range is limited: expected high ~555.0, expected low ~528.0 and an expected close at 537.0 (–1.65% expected change).
Volume and capital-flow confirmation — mixed but leaning bearish
Relative volume is just above average (RVOL ~1.03) with session volume increasing. VFI is negative but rising and MFI has moved bullish (current MFI 67.52), indicating short-term buying interest into the correction. Directional order flow shows a seller-dominant imbalance (buy_pct 34.28 / sell_pct 65.72) with large-order capital flow netting heavily negative (large net outflow ≈ -83,878,924.2). The model interprets this as participation that supports the structural bearish case but without decisive breakout/breakdown confirmation — hence the cautious stance.
Options positioning — puts cluster underpins the 540 floor
Options data show elevated put/call open interest (OI P/C ≈ 1.82) with concentrated put OI and volume at the 540 strike (near‑term expiry 2026‑08‑21). Call interest clusters around 580 and a call OI band at ~577.1–582.9 provides a resistance zone higher up. The prediction agent uses these strikes to refine S/R: the 540 put concentration reinforces the nearby downside floor, while call clusters mark supply toward the mid‑to‑upper 500s. However, options positioning is not being treated as a standalone trigger for a trade.
News & macro context — mixed company story, medium event risk
The news backdrop is MIXED with company positives (sustained ad growth, product initiatives) and persistent negatives (heavy AI/compute spending, elevated CapEx, one‑time charges). Macro event risk this week is MEDIUM — initial jobless claims and Fed‑related commentary are live catalysts that can re‑price growth names. The model flags the calendar as a potential volatility source but notes no company‑specific event for Meta in the immediate window.
Outlook
The most likely path is an early session test of the 540 zone (537–543). If that zone fails on expanding sell volume (bearish confirmation defined as break and hold below 537.0 on rising RVOL and large‑order outflow), expect extension toward the 527.5 60‑minute swing low (intraday low ~528). If 540 holds, price should chop between 540 and the 549–556 resistance band with limited upside. Bullish confirmation requires a sustained reclaim above 556.0 on decent volume. Given price proximity to primary support, mixed participation and elevated put positioning, the model issues NO_TRADE at market open and recommends waiting for either a clear break below 537 with volume confirmation or a sustained reclaim above 556 before taking a directional position.
This article was generated by automated AI agents synthesizing technical, volume/flow, options, and news data — no human analyst reviewed it before publication.
It is provided for informational and educational purposes only and does not constitute investment, financial, trading, or legal advice, nor a recommendation or solicitation to buy or sell any security. This article may discuss both a near-term (next trading session) outlook and a separate longer-horizon (multi-month) scenario; the longer-horizon discussion is a deliberately broad, illustrative range of possible outcomes based on currently available information, not a price target or forecast, and is inherently more uncertain the further into the future it looks. AI-generated analysis may be incomplete, outdated, or inaccurate, and any forecasts, levels, or trade ideas described are not guaranteed and may not occur. Past patterns do not predict future results. Trading and investing involve substantial risk, including the risk of loss of principal. Always conduct your own research and consult a licensed financial advisor before making any investment decision. This platform and its operators assume no liability for actions taken based on this content.
Reference price at generation: $546.03.