MSFT set to test 479–482 support after corrective pullback; model recommends standing aside ahead of jobless-claims data
Model: mild bearish for next session; primary intraday support 479–482, resistance clustered 485–500; no trade recommended until confirmation.
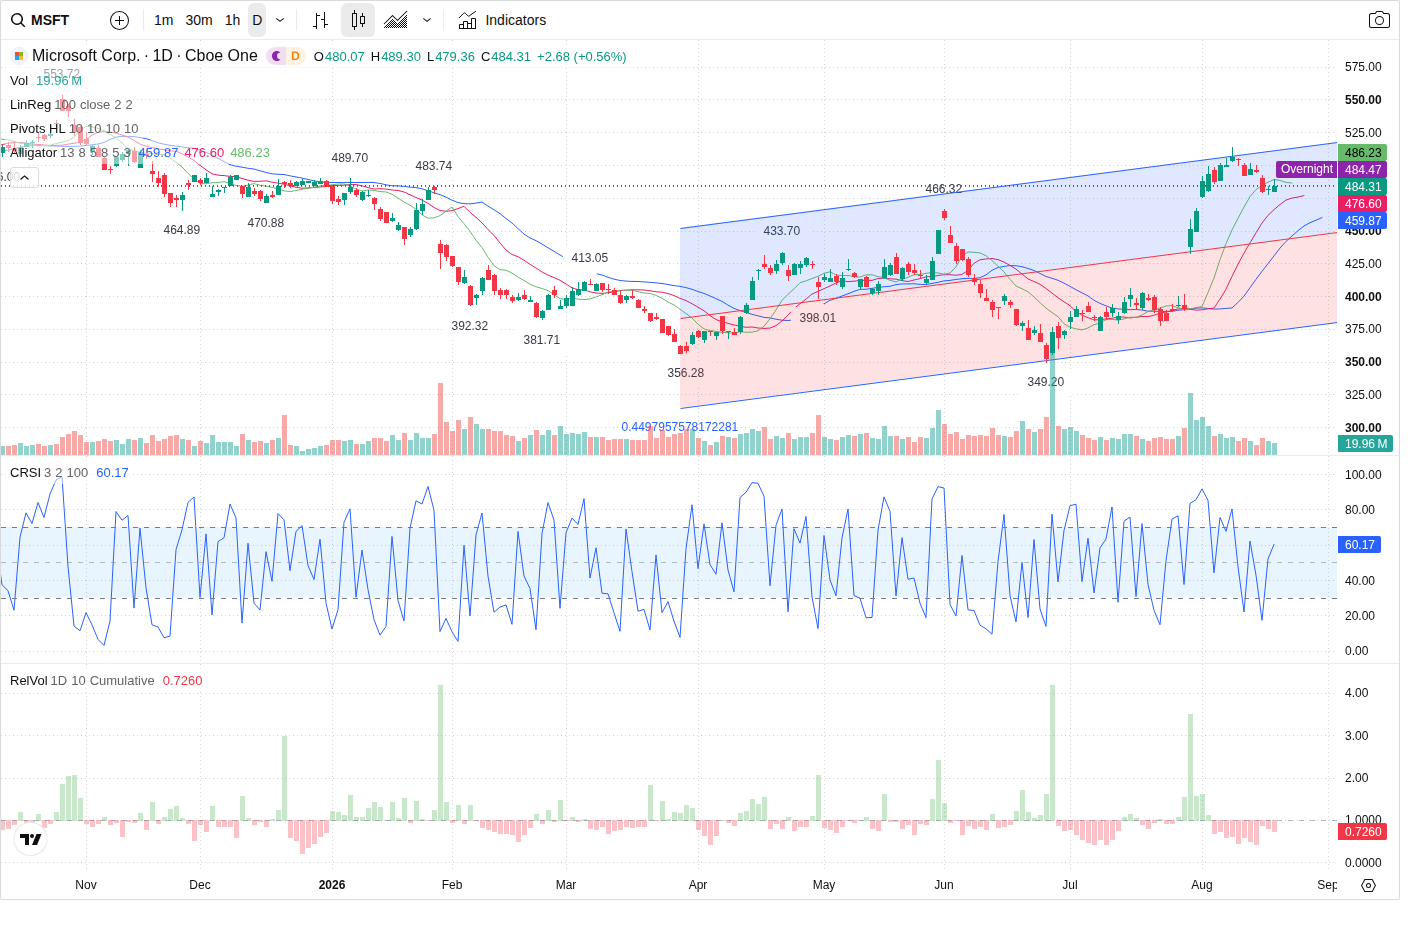
Microsoft (MSFT) is trading at 484.31 in premarket trade and the model’s next-session call favours a choppy-to-mildly-bearish day: an early push into the 485–490 area, an intraday test of the 479–482 support cluster and a likely close slightly below the reference near 482.5.
Technical picture — corrective structure, reversal not confirmed
The prediction agent flags a BEARISH_PULLBACK_REVERSAL setup that remains 'waiting_for_reversal.' Multi-timeframe signals are mixed: the 5‑minute shows a SHORT bias inside a corrective channel with recent intraday lows ~479.09–481.31 and an invalidation price at 500.01; the 60‑minute is in a LONG trend overall but currently in a correction with price sitting near the lower channel boundary (~477–485 area); the daily trend is tagged SHORT and price is trading through corrective resistance. The model’s primary support zone is 479.0–482.0 (reference support 480.0) and the primary resistance cluster is 485.0–500.0 (with a focused resistance at 490.0). Reversal remains unconfirmed, so the technical edge is conditional on either a decisive reclaim above 490.00 or a breakdown under 479.00.
Volume & money-flow — light participation, seller tilt
Volume is below recent averages (RVOL ≈ 0.5425) and the 5‑day/20‑day comparisons show lower participation; the packet reports volume trend decreasing. VFI is rising and positive (current 6.3068), which signals some underlying buyer presence, but minute-level directional stats favour sellers (buy_pct 44.89 vs sell_pct 55.11; net imbalance -54,841). Net capital flow across the sample is negative (large-order net outflow ≈ -26,365,618.50), so the model sees insufficient confirming volume for a reliable reversal. Given light participation, intraday moves are likely to be choppy and vulnerable to macro headlines.
Options & volatility — call concentration above, put support below
Options positioning concentrates calls around the 500.0 strike (largest call OI) and notable put OI sits near 460.0. Near‑term active strikes include 485, 480 and 490; 480/485 strikes also show mixed put activity. The low put/call volume and OI ratios point to more call-side positioning (volume_put_call_ratio ~0.328, oi_put_call_ratio ~0.430), which can create resistance in the 490–500 area while the put open interest around 460 acts as a lower magnet if sellers accelerate. Implied volatility (current IV 0.2899) is materially below historical volatility (HV ~0.5797), consistent with the view that option market stress is moderate.
News & macro — mild bullish company tone, medium macro event risk
News bias is mildly bullish driven by the post‑July earnings beat; company‑specific catalysts are limited in the immediate window. Near‑term directional risk is dominated by macro (weekly initial jobless claims on Aug 20 and PCE on Aug 26). The prediction agent flags event risk as MEDIUM — a hawkish macro surprise or hotter-than-expected labour data could quickly override mixed technicals and lighter liquidity to produce outsized downside.
Outlook
Most likely path: opening chop into 485–490, an early test of the 479–482 support (intraday low ~478–480 possible), a bounce/retest into the 488–490 area and a session close slightly below the reference (~482.5). Bullish confirmation requires a sustained reclaim and hold above 490.00 on expanding volume; bearish confirmation is a sustained breakdown below 479.00 with rising selling volume. Given the unconfirmed reversal, below‑average volume and negative large‑order flow, the model’s trade idea is NO_TRADE for the next session — stand aside until one of the confirmation thresholds is met or until macro headlines force a clear directional move.
This article was generated by automated AI agents synthesizing technical, volume/flow, options, and news data — no human analyst reviewed it before publication.
It is provided for informational and educational purposes only and does not constitute investment, financial, trading, or legal advice, nor a recommendation or solicitation to buy or sell any security. This article may discuss both a near-term (next trading session) outlook and a separate longer-horizon (multi-month) scenario; the longer-horizon discussion is a deliberately broad, illustrative range of possible outcomes based on currently available information, not a price target or forecast, and is inherently more uncertain the further into the future it looks. AI-generated analysis may be incomplete, outdated, or inaccurate, and any forecasts, levels, or trade ideas described are not guaranteed and may not occur. Past patterns do not predict future results. Trading and investing involve substantial risk, including the risk of loss of principal. Always conduct your own research and consult a licensed financial advisor before making any investment decision. This platform and its operators assume no liability for actions taken based on this content.
Reference price at generation: $484.31.