AMD near short-term support 462.55 after a -3.71% drop; model flags mild bearish bias into next session
5-minute short structure pushing price toward a 458.0–463.5 support zone; options/call OI and volume-profile create resistance in the 475.0–488.0 area and event risk remains elevated.
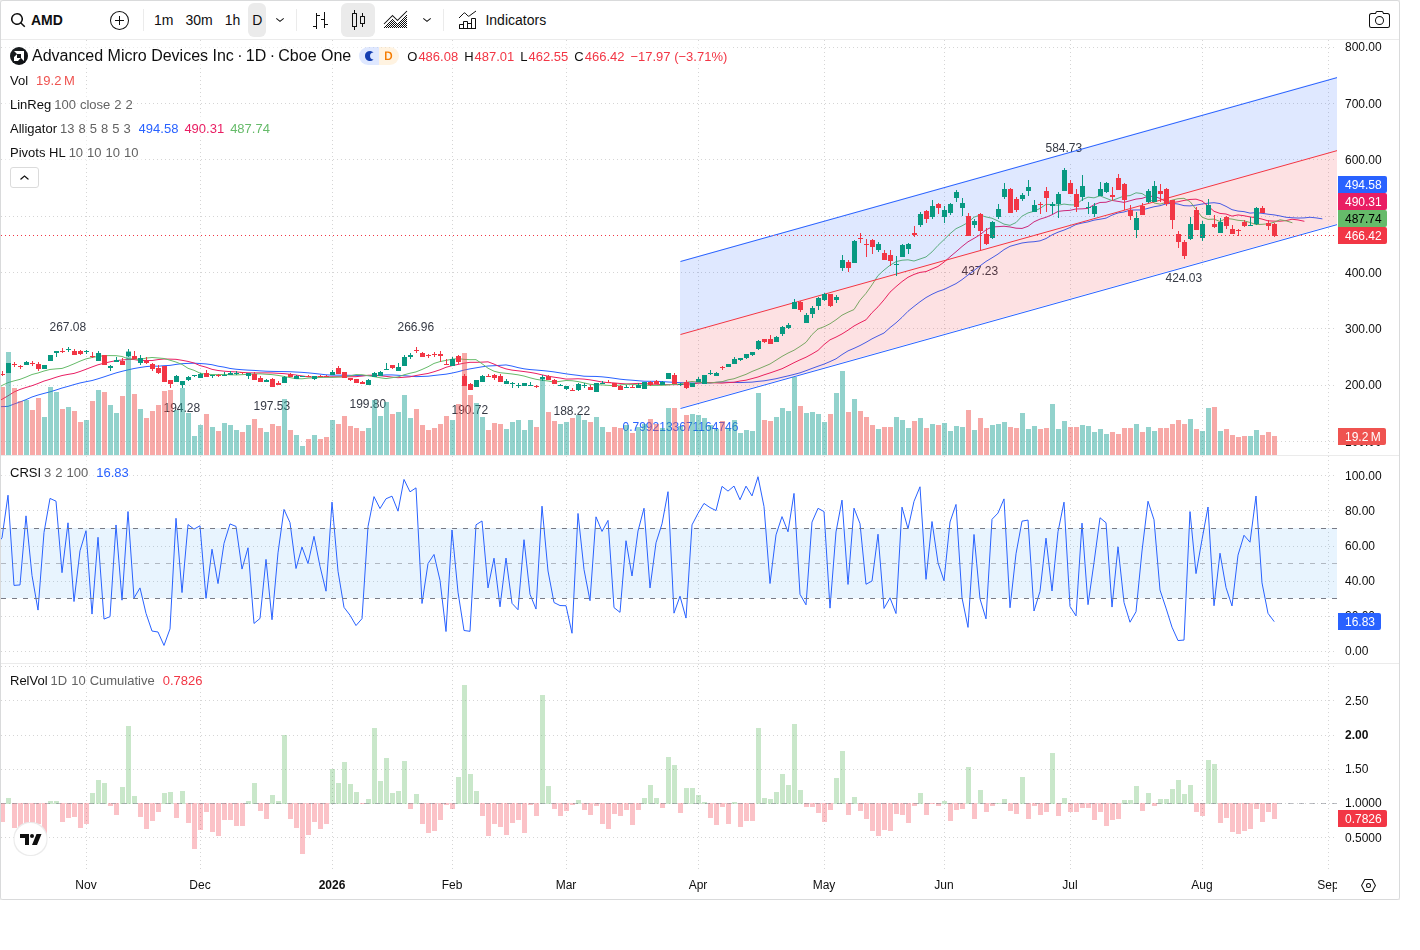
Advanced Micro Devices (AMD) is trading around 466.42 in premarket after a -3.7098% intraday drop, with the prediction model calling a mild-bearish next session and the most likely path into the 462.55 support zone (458.0–463.5).
Technical picture — short on the intraday frame, longer-term channel intact
Short-term technicals show a clear 5-minute LH/LL structure and a corrective short bias on the 5m chart; the model lists the 5m trend as SHORT with trend strength 100.0 and identifies the nearest support at the 5m swing low of 462.55. On the 60-minute and daily timeframes the longer-term trend remains constructive (both flagged LONG with trend_strength 100.0) and the daily lower-channel trendline sits near ~458.7, which helps form the primary support zone 458.0–463.5. The immediate resistance cluster is centered on the volume-profile and options-derived level 477.6 (zone 475.0–488.0). The prediction confidence is 65 and the model’s expected close for the session is 461.94.
Volume and capital flow — below-average participation, mixed flow
Intraday participation is muted: RVOL is ~0.70 and current volume (17,739,888) sits below the 5d and 20d averages, consistent with the model’s 'below-average volume' read. VFI is positive and rising and order-flow slightly favors buyers (imbalance +2,887, buy_pct 50.31), while MFI has rolled down from recent highs but is still in neutral range. Capital-flow metrics show net large-buy inflows (large net +2,424,649.71) offset by medium-order outflows; overall the volume/flow picture provides only limited confirmation of a durable reversal, which is why the model stops short of recommending a fresh directional trade.
Options and volatility — protective puts and concentrated call OI shape levels
Options positioning is biased toward puts: total_put_oi 42,796 vs call_oi 18,588 (oi_put_call_ratio ~2.30) with concentrated put OI and volume at strikes 450 and 465 for near-term expiries. On the call side the largest open interest clusters around the 480 strike and the model highlights a major positioning zone at 477.6–482.4, which aligns with the volume-profile POC/HVN cluster (POC 507.7286833333334; HVN at ~487.64138333333335). Implied volatility sits at 0.6011 while historical volatility is 0.7996765173810431; the skew toward puts increases downside sensitivity and reinforces the model’s view that upward progress will meet option-derived resistance in the 475–488 area.
News & event risk — sector-driven decline, high near-term catalyst risk
There is no material AMD-specific disclosure driving the drop; the packet and model describe the move as sector-led amid chip/AI rotation and macro headlines (Fed minutes, rate commentary). Event risk is classified as HIGH — the Prediction Agent flags NVIDIA earnings (late Aug 24–28) and incoming Fed/inflation commentary as binary catalysts that can produce correlated moves across the AI/data-center complex. Given that backdrop, the model's next-session bias is 'MILD_BEARISH' and it stresses that traders should account for elevated event risk when sizing or timing entries.
Outlook
The model’s most likely path is early weakness into the primary support zone 458.0–463.5 (key level 462.55). If buyers defend that area look for a contained bounce toward the 475.0–480.0 resistance band where concentrated call OI and the volume-profile HVN are likely to apply selling pressure. A decisive break and hold below 462.55 would open the faster path toward the secondary support at 424.03. Given muted volume, mixed timeframe structure, heavy options positioning and HIGH event risk, the Prediction Agent recommends NO_TRADE for a fresh directional position until either a confirmed breakdown under 462.55 on rising volume or a sustained reclaim above 475.00 is seen.
This article was generated by automated AI agents synthesizing technical, volume/flow, options, and news data — no human analyst reviewed it before publication.
It is provided for informational and educational purposes only and does not constitute investment, financial, trading, or legal advice, nor a recommendation or solicitation to buy or sell any security. This article may discuss both a near-term (next trading session) outlook and a separate longer-horizon (multi-month) scenario; the longer-horizon discussion is a deliberately broad, illustrative range of possible outcomes based on currently available information, not a price target or forecast, and is inherently more uncertain the further into the future it looks. AI-generated analysis may be incomplete, outdated, or inaccurate, and any forecasts, levels, or trade ideas described are not guaranteed and may not occur. Past patterns do not predict future results. Trading and investing involve substantial risk, including the risk of loss of principal. Always conduct your own research and consult a licensed financial advisor before making any investment decision. This platform and its operators assume no liability for actions taken based on this content.
Reference price at generation: $466.42.