SPY eyes 766.92 support after 5‑minute LH/LL; short bias if that zone breaks toward POC ~749.80
Model flags a mild bearish next session: watch 766.92 support and 772.47–776.10 resistance band; a break below 766.92 opens a path to the volume POC at 749.797.
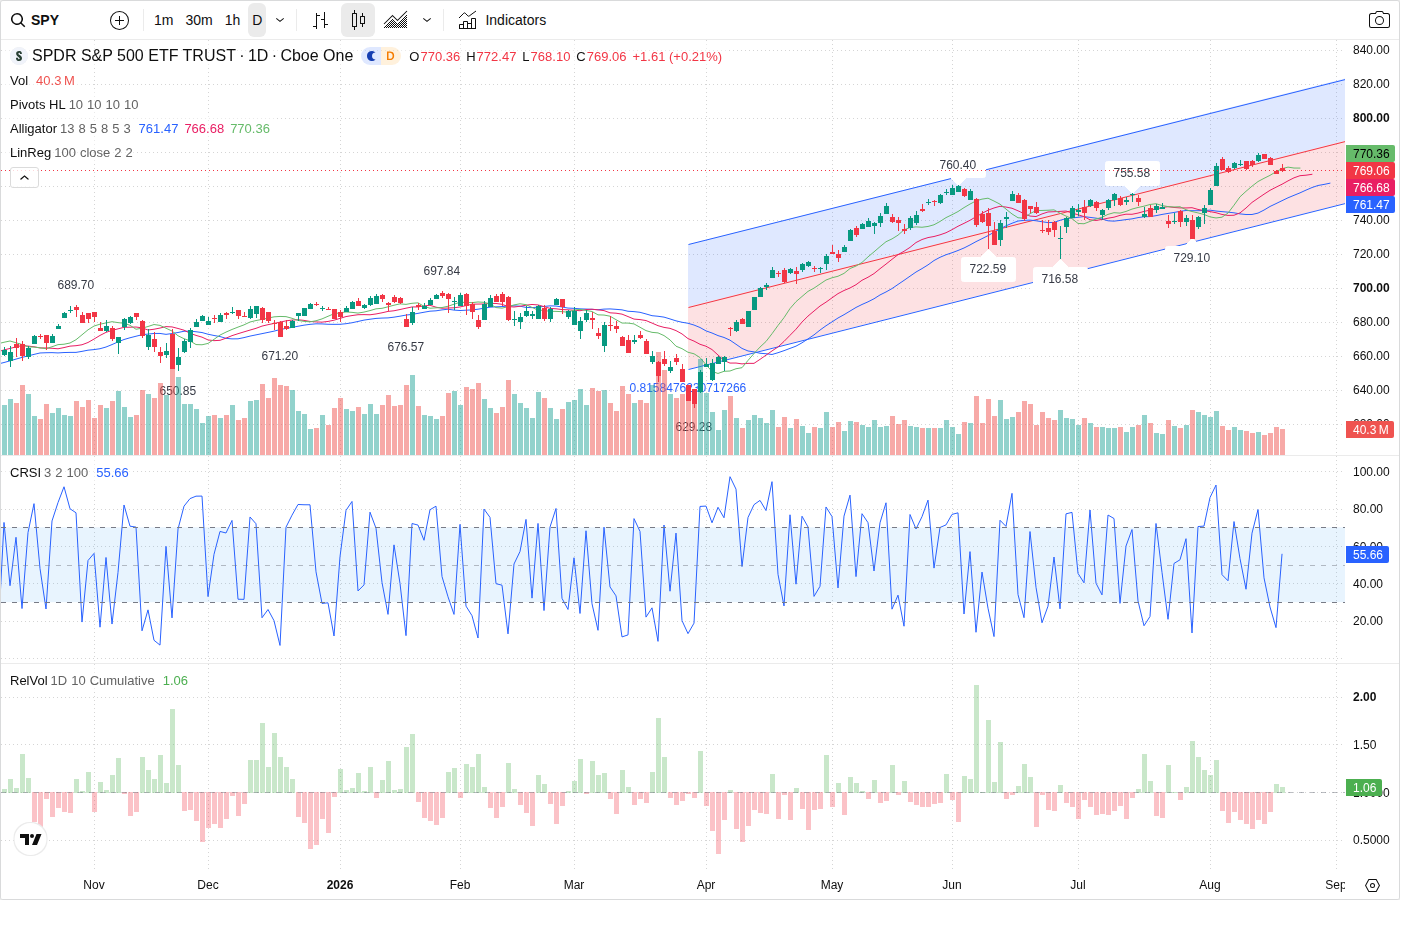
SPY is trading near 769.06 in premarket after forming a 5‑minute lower‑high / lower‑low structure. The prediction model’s highest‑probability path for the next regular session is a test of the 766.92 support cluster, with a bearish outcome if that level fails on increasing selling volume.
Technical picture — short in the short term, broader trend still long
On the intraday 5‑minute frame SPY shows a clear LH_LL short structure with the immediate reaction low at 766.92 and the nearest 5‑minute resistance at 772.47. The model labels the candidate direction SHORT and an approaching_entry_zone setup_type BEARISH_PULLBACK_REVERSAL. Higher‑timeframe context remains constructive: both the 60‑minute and daily trends are classified LONG, but corrective short trends are active. The primary short trigger is a break and close below 766.92 (bearish confirmation); reclaimed and sustained trading above 776.10 (bullish confirmation) would invalidate the short.
Volume & flow — participation muted but sellers currently dominate
Intraday participation is below average (RVOL ~0.83) even as VFI remains positive and rising; MFI reads bullish (~70) but directional order flow shows sellers in control (buy_pct 47.67 / sell_pct 52.33; net imbalance -97,571). Capital‑flow sampling shows a net outflow in large orders (net ≈ -75,001,131) supporting the shorter‑term pullback thesis. The volume profile POC at 749.7970833333334 is the structural magnet if selling accelerates; nearest HVNs include 749.797 and 773.4554 which speak to possible support/resistance clustering.
Options positioning — resistance above, put skew below
Options activity tilts cautious: total_put_volume (116,869) exceeds calls (92,597) and OI put/call ratio >1 (1.218). Important strikes cluster around 770 (heavy volume) and larger call OI at 780 and the call concentration band 776.1–783.9, which the model cites as an immediate resistance zone. Substantial put OI sits lower at strikes like 720/730, reinforcing the POC area as a downside magnet if sellers push price through the 766.92 zone.
News & macro — mixed signals keep event risk elevated
Macro headlines are mixed and flagged as MEDIUM event risk. Treasury buyback announcements pushed yields lower intraday (supportive), while recent Fed minutes left the possibility of higher rates on the table (a restraint on sustained risk appetite). Near‑term economic prints to watch are Initial Jobless Claims (Thu Aug 20) and PCE (Aug 26). The news summary rates next‑session bias NEUTRAL and multi‑day bias MILD_BULLISH, but the technical short on the 5‑minute chart and the options/flow lean toward a cautious near term.
Outlook
Most likely next‑session path is a retest of the 766.92 support cluster. If sellers force a break and close below 766.92 with expanding selling volume (bearish confirmation), expect acceleration toward the volume POC at 749.7970833333334. If 766.92 holds, expect chop between 766.92 and the 772.47–776.10 resistance band with a late‑session bias lower. Model confidence is moderate (prediction_confidence 65); event risk (jobless claims, upcoming PCE) means outcomes can flip if macro data surprises. The short trade idea is entry ~765.0, stop 773.0, target_1 749.7970833333334 (R:R ~1.9); invalidation is sustained reclaim above 776.10 on strong bullish volume.
This article was generated by automated AI agents synthesizing technical, volume/flow, options, and news data — no human analyst reviewed it before publication.
It is provided for informational and educational purposes only and does not constitute investment, financial, trading, or legal advice, nor a recommendation or solicitation to buy or sell any security. This article may discuss both a near-term (next trading session) outlook and a separate longer-horizon (multi-month) scenario; the longer-horizon discussion is a deliberately broad, illustrative range of possible outcomes based on currently available information, not a price target or forecast, and is inherently more uncertain the further into the future it looks. AI-generated analysis may be incomplete, outdated, or inaccurate, and any forecasts, levels, or trade ideas described are not guaranteed and may not occur. Past patterns do not predict future results. Trading and investing involve substantial risk, including the risk of loss of principal. Always conduct your own research and consult a licensed financial advisor before making any investment decision. This platform and its operators assume no liability for actions taken based on this content.
Reference price at generation: $769.06.