QQQ set to test 712.61 support; model flags mild bearish edge ahead of CPI
Prediction model sees early weakness toward intraday support (712.61) with a secondary pull to the VAL ~704.885 if selling accelerates; trade idea: NO_TRADE into the U.S. CPI event.
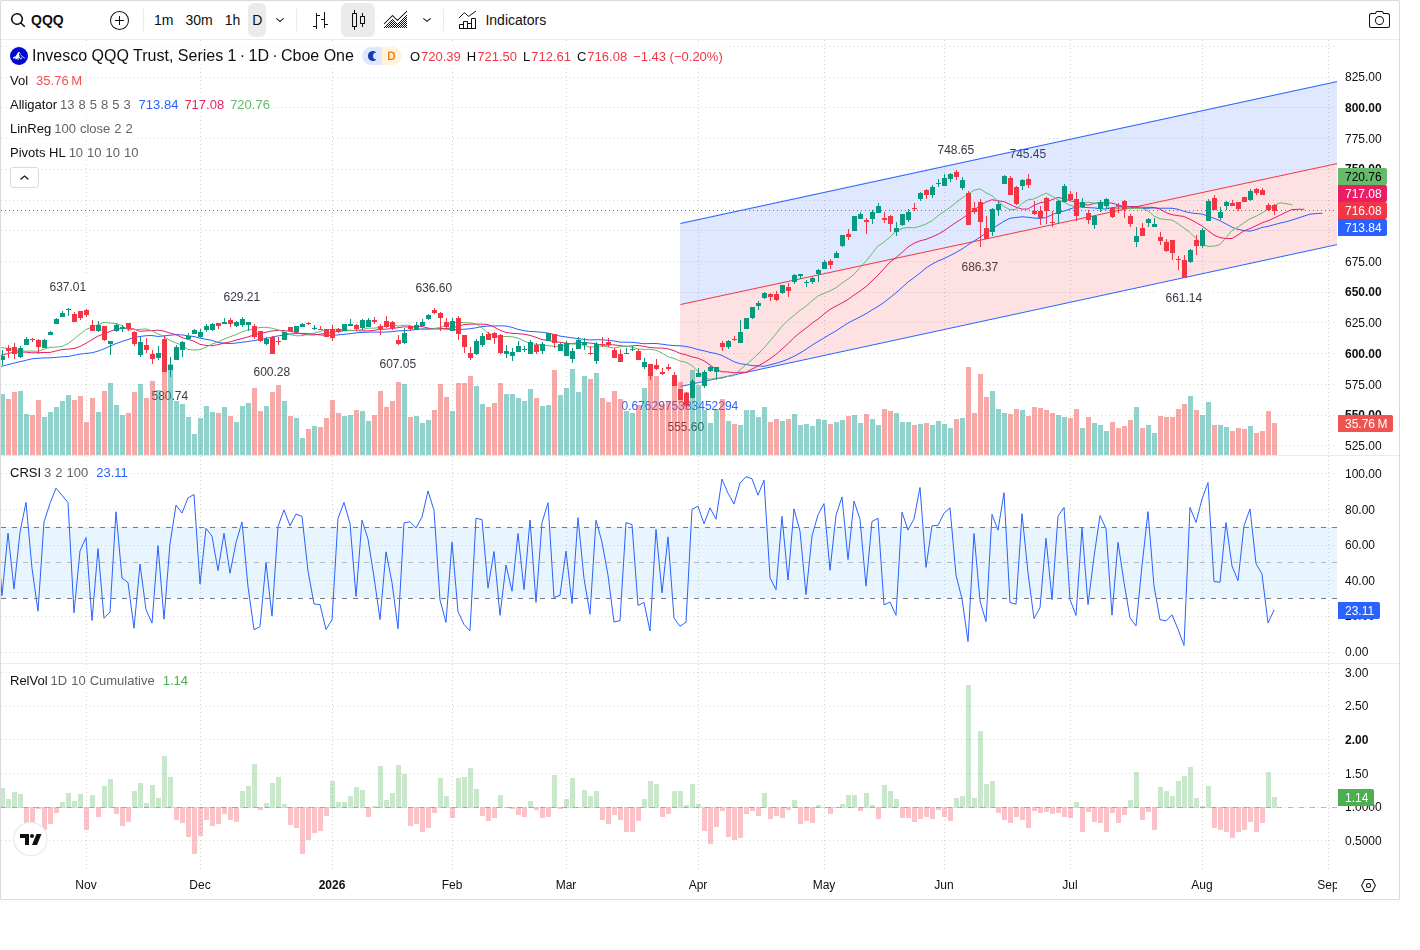
QQQ trades at 716.08 in premarket, sitting just below the intraday POC and inside a tight range. The model's highest-probability path for the next session is mild bearish: an early probe of 712.61 with downside extension to the volume-validated VAL ~704.885 if selling volume picks up; given high CPI event risk the recommended stance is no new directional trades.
Technical picture — short intraday bias inside broader channel
Multi-timeframe structure is mixed: the 5-minute chart is explicitly SHORT with a LH/LL corrective structure and correction_active, while 60-minute and daily retain longer-term LONG channel context but show corrective short trends. Key intraday anchors cited by the model are support at 712.61 and the volume-profile VAL at 704.885 (secondary_support). Immediate resistance sits in the 717.6439583333333–724.0 band (POC + 5-min/60-min swing highs + options interest). The prediction calls for an early session test of 712.61; failure to hold on expanding sell volume would target the VAL ~704.885.
Volume and flow — participation supports cautious bearish tilt
Volume is below the 20-day average (RVOL ~0.89) but rising relative to recent sessions; current volume 31,336,366 vs average 5d 29,148,771.4. Directional data shows sellers dominating yesterday (net imbalance -317,932; sell_pct 58.84). VFI is positive and rising but large-order capital flow is net negative (total net ~-227,655,102.15), indicating institutional outflow pressure. The model interprets these mixed participation signals as confirmation of a cautious bearish tilt but not a decisive institutional stamp—hence the low conviction for initiating fresh shorts pre-event.
Options and volatility — put OI concentration underpins lower support band
Options positioning is asymmetric: total_put_oi (309,714) exceeds total_call_oi (283,196) giving an OI put/call ratio ~1.0936. Heavy put clusters exist at 680 and 700 expiries, while large call activity concentrates at the 720 and 730 strikes. The 700–710 put concentrations and volume-profile VAL align with the 704.885–713.0 support zone the model highlights. IV sits at 0.1783 with realized vol higher (HV 0.23775082473877626); the IV/HV spread is -0.0595, consistent with moderate event premium already priced ahead of CPI.
News / macro — CPI raises event risk; near-term bias mildly bullish but volatile
Macro headlines are mixed: the U.S. Treasury's announcement on Aug 19 easing long yields gave the market some relief, supporting a mild bullish next-session bias in news analysis. Crucially, U.S. CPI (Aug 20, 08:30 ET) is classified as HIGH event risk and the model assigns only 55% prediction confidence. That elevated event risk — coupled with concentrated large-cap tech earnings ahead — is the primary reason the framework recommends NO_TRADE before the print despite a technically actionable intraday structure.
Outlook
Most likely path: early-session weakness probes 712.61. If 712.61 holds, expect a bounce toward the 717.6439583333333–720.00 resistance band where sellers may reassert (range or fade opportunity). A break and close below 712.61 with accelerating sell volume is the bearish confirmation and would open an extension toward VAL ~704.885 (and the 700 area where put OI clusters). Conversely, sustained reclaim and hold above 720.00 on rising buying volume would invalidate the short bias. Given the high CPI event risk and the model's LOW trade conviction, the recommended stance is to wait for post-event structure and volume confirmation before initiating directional positions.
This article was generated by automated AI agents synthesizing technical, volume/flow, options, and news data — no human analyst reviewed it before publication.
It is provided for informational and educational purposes only and does not constitute investment, financial, trading, or legal advice, nor a recommendation or solicitation to buy or sell any security. This article may discuss both a near-term (next trading session) outlook and a separate longer-horizon (multi-month) scenario; the longer-horizon discussion is a deliberately broad, illustrative range of possible outcomes based on currently available information, not a price target or forecast, and is inherently more uncertain the further into the future it looks. AI-generated analysis may be incomplete, outdated, or inaccurate, and any forecasts, levels, or trade ideas described are not guaranteed and may not occur. Past patterns do not predict future results. Trading and investing involve substantial risk, including the risk of loss of principal. Always conduct your own research and consult a licensed financial advisor before making any investment decision. This platform and its operators assume no liability for actions taken based on this content.
Reference price at generation: $716.08.