C eyes 136.20–136.90 support; model flags mild bullish session toward 140 area but recommends no new trade
Prediction model sees a mild bullish tilt for Citigroup into the next session with a near-term test of 136.20–136.90 and resistance clustered at 139.3–140.7; no clean intraday trade is recommended until reversal or breakout is confirmed with volume.
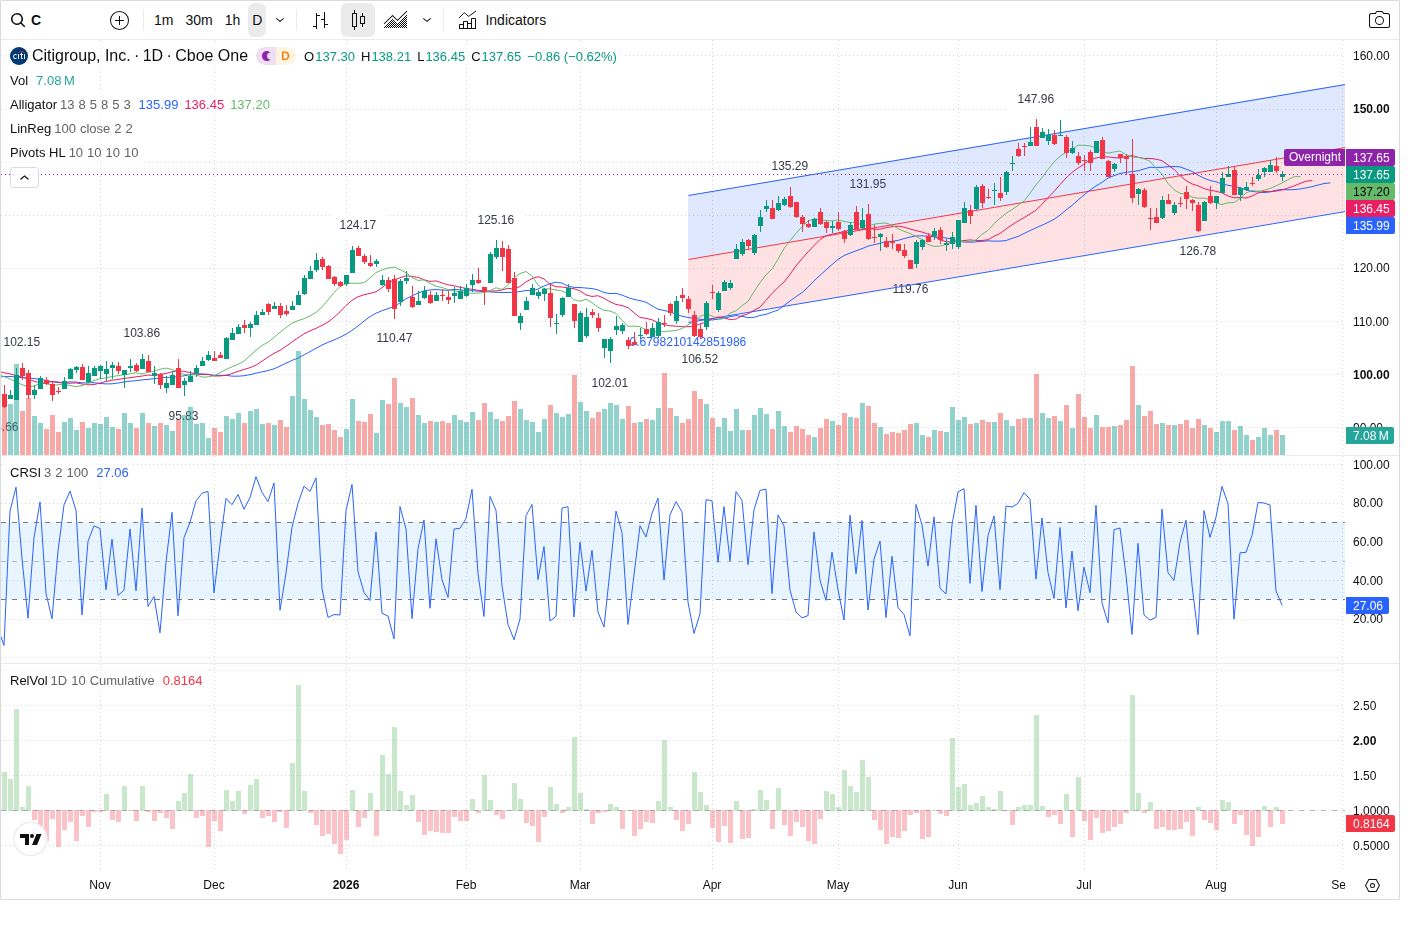
Citigroup (C) is trading around 137.65 premarket after a small pullback from recent intraday highs; the prediction model expects an early test of the 136.20–136.90 support zone and a recovery attempt into the 139.3–140.7 resistance band, but declines to recommend initiating a directional trade before high‑quality confirmation.
Technical picture — corrective pullback inside broader uptrend
Across daily, 60‑minute and 5‑minute timeframes the model labels the trend as overall bullish with a short‑term corrective (short) leg active. The primary short‑term support cluster is 136.45 (zone 136.20–136.90) — drawn from 5‑minute swing lows and corrective channel edges — while immediate resistance sits at 140.00 (zone 139.30–140.70). Secondary anchors are the volume‑profile POC at 133.02 (secondary support) and the 60m recent high 144.28 (secondary resistance). The expected session high is near 141.0 on a breakout attempt; the model’s expected close is 139.75 (expected change +1.540624287892111%).
Volume and money‑flow — participation light, order flow favors sellers
Intraday participation is muted: RVOL ~0.85 and current volume sits below the 20‑day average (volume_vs_20d_avg_pct -15.21) despite a rising very short‑term volume trend. VFI remains positive but is falling; MFI is bullish at 65.34 and rising. Directional large‑order flow shows net outflow (large net -2,027,938.14 at the sample level) and intraday order imbalance favors sellers (buy_pct 45.11 / sell_pct 54.89). The model flags these mixed signals — constructive MFI/VFI backdrop but insufficient buying participation — as a reason to withhold a defined long until volume confirms.
Options positioning and event risk — 140 is a nearby options magnet; Fed minutes loom
Short‑dated options concentrate call open interest at the 140 strike (largest_call_oi_strike 140.0) and the model maps a positioning zone at 139.3–140.7 that reinforces technical resistance. Put OI clusters near 130 (largest_put_oi_strike 130.0) providing a distant lower boundary. Volatility metrics show IV ~0.2896 slightly above realized (HV 0.2641). Event risk is rated MEDIUM: the FOMC minutes release (Aug 19, 2:00 PM ET) is the primary near‑term macro catalyst that could quickly change intraday direction for bank stocks.
Session trade plan — scenarios and confirmations
Base case (mild bullish): buyers defend 136.20–136.90 and price grinds toward 139.3–140.7, with upside extension above 140.70 targeting 144.28 if accompanied by sustained volume. Range: failure to move decisively between the two zones leads to choppy trade, in which case fading edges is the recommended intraday approach. Bearish: break and hold below 136.20 on rising selling volume would open a path to the POC at 133.02. Bullish confirmation requires a sustained reclaim above 138.50 with above‑average buy volume and improving VFI/MFI; bearish confirmation is a break and hold below 136.20 on expanding sell volume. The model’s trade_idea is NO_TRADE — conviction LOW — because reversal is not confirmed, RVOL < 1 and order flow currently favors sellers, producing marginal risk/reward for a defined long against 136.45.
Outlook
The most likely path is an early session probe of 136.20–136.90. If buyers defend that zone and volume improves, expect a recovery into the 139.3–140.7 resistance band with an intraday upside target near ~141. A decisive high‑volume reclaim above 140.70 or, conversely, a high‑volume break below 136.20 would invalidate the current hold‑off and create tradable directional setups. Given medium event risk from the FOMC minutes and mixed volume/order‑flow confirmation, the model recommends waiting for one of those confirmations before taking new directional risk.
This article was generated by automated AI agents synthesizing technical, volume/flow, options, and news data — no human analyst reviewed it before publication.
It is provided for informational and educational purposes only and does not constitute investment, financial, trading, or legal advice, nor a recommendation or solicitation to buy or sell any security. This article may discuss both a near-term (next trading session) outlook and a separate longer-horizon (multi-month) scenario; the longer-horizon discussion is a deliberately broad, illustrative range of possible outcomes based on currently available information, not a price target or forecast, and is inherently more uncertain the further into the future it looks. AI-generated analysis may be incomplete, outdated, or inaccurate, and any forecasts, levels, or trade ideas described are not guaranteed and may not occur. Past patterns do not predict future results. Trading and investing involve substantial risk, including the risk of loss of principal. Always conduct your own research and consult a licensed financial advisor before making any investment decision. This platform and its operators assume no liability for actions taken based on this content.
Reference price at generation: $137.65.