AMZN near-term bias mildly bearish — next session keyed to 257.00 support and FOMC minutes
Model expects a probe of intraday support at 257.00–257.73; no high‑confidence trade until either a clear break or a reclaim above 265.00.
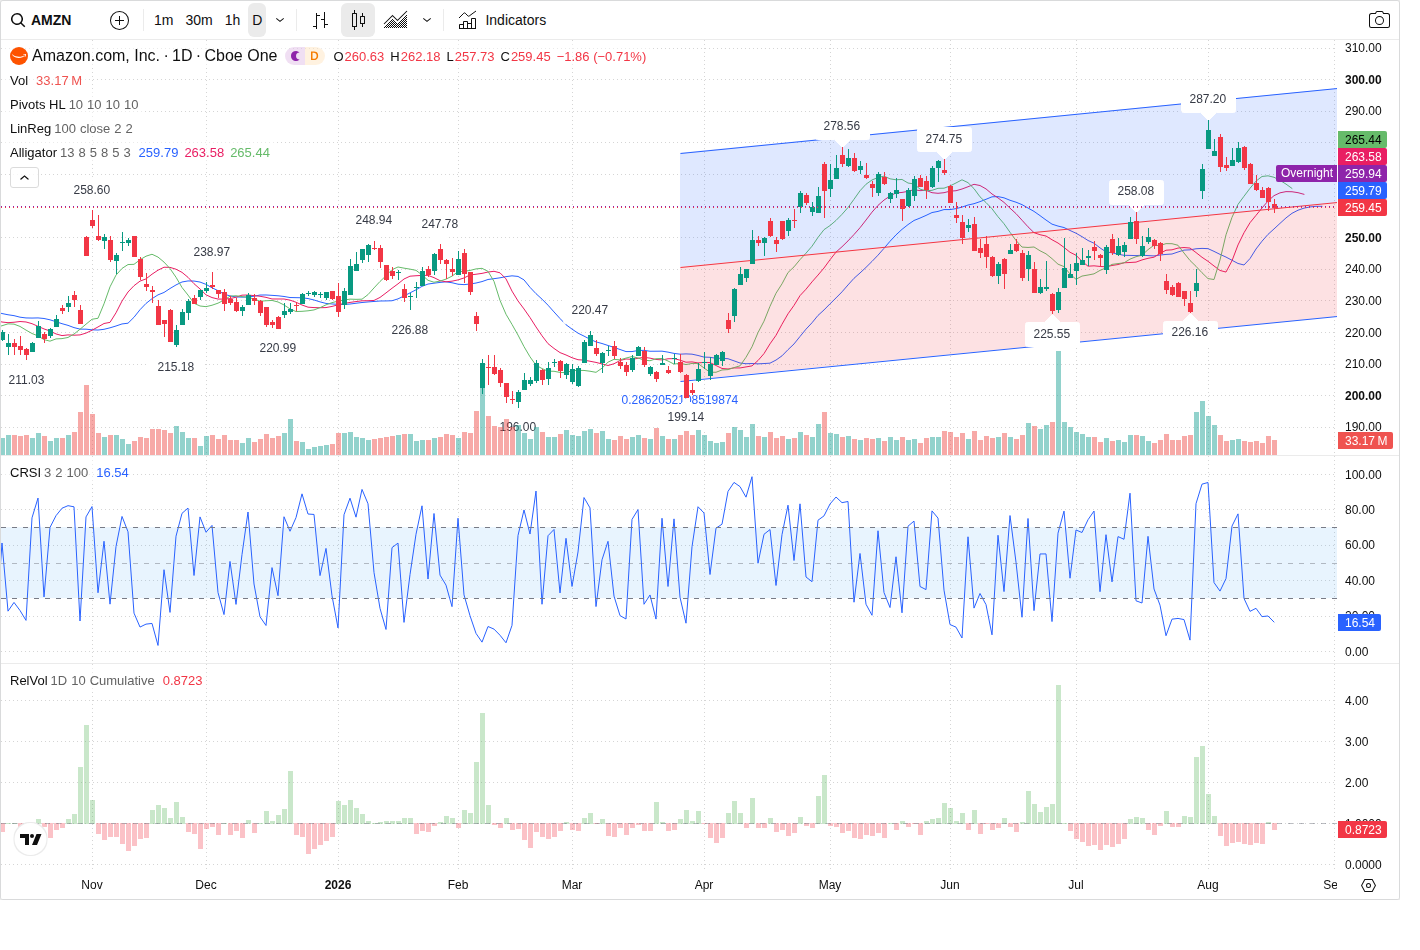
Amazon (AMZN) is trading at 259.45 in the premarket with a mild bearish tilt for the next session: the prediction model sees an initial probe toward the 257.00–257.73 intraday support zone and says traders should wait for a decisive break or reclaim before taking directional positions.
Technical picture — intraday sellers, higher-timeframe mixed
The short-term structure is dominantly bearish: the 5-minute chart shows a LH/LL pattern with corrective activity, placing immediate resistance at the 262.18 short-term swing high (resistance band 262.0–265.0). The prediction calls the nearest validated intraday support at 257.73 and defines a support zone of 257.0–259.0. On the 60‑minute and daily timeframes the trend is mixed-to-long (both flagged LONG with short corrective moves), so upside remains capped by the identified resistance band. The model’s expected next-session range: intraday low ~255.00, expected close ~257.00, and intraday high ~263.50 — consistent with a mild bearish edge rather than an aggressive trend continuation.
Volume and capital flow — participation muted, order flow slightly negative
Volume is below longer-term averages (RVOL 0.71) with a decreasing volume trend; current session volume (30,929,903) is roughly in line with recent 5‑day averages but below 20‑day norms. VFI is positive and rising (current 7.33) while MFI sits neutral (~51.58). Directional flow shows sellers dominating (buy_pct 46%, sell_pct 54%, imbalance -101,190). Capital-flow data records net large outflows (net ~-26,455,977 for large trades). Taken together, participation is muted and order flow modestly favors sellers — the model interprets that as increasing the odds of a shallow decline toward 257 rather than a high‑velocity drop absent an event trigger.
Options and volatility — defined resistance around call concentrations
Options positioning reinforces the short-term resistance band: concentrated call open interest clusters around the 270 strike (largest call OI at 270) and heavy call OI also sits at 270.0–268.65–271.35 (major positioning zone). Nearest strikes show notable activity at 260 (call OI 36,965) and 265 (call volume heavy), while the largest put OI is at 250 with a put-interest band at 248.75–251.25 acting as secondary support. IV is 0.3146 with realized vol higher (HV ~0.6148), so IV/HV spread is negative and options pricing does not indicate a large near-term volatility premium. Overall, options create a seller zone in the 262–270 area and a protective put floor near 250.
News and events — FOMC minutes create medium event risk
News flow is mixed and event risk is medium: the FOMC minutes (Jul 28–29) are scheduled for release on Aug 19 and are the most important near-term macro event cited by the model. The macro backdrop is conflicted — softer inflation prints lower the odds of further tightening (constructive for growth) while recent upward moves in long-end Treasury yields have pressured high-multiple tech stocks, including Amazon. There are no company-specific catalysts in the next session; sector earnings and Jackson Hole remain multi‑day risks but fall outside the immediate prediction horizon.
Session trade plan and model guidance
The model’s trading guidance is conservative: it assigns a mild-bearish probability to the next session (bearish 50%, range 30%, bullish 20%) but lists the official trade idea as NO_TRADE with LOW conviction. The preferred monitoring levels are a bearish confirmation at 257.00 (sustained break and close with expanding selling volume would target the volume-profile POC at 246.16) and a bullish invalidation at 265.00 (sustained close above 265.00 on rising volume would open 270.00 and larger daily resistance at 278.56). If price remains between 257.00 and 265.00 the model expects chop and recommends range management rather than initiating fresh directional risk.
Outlook
Most likely path for the next session is an early probe to the 257.00–257.73 intraday support area; if that level holds on muted selling volume expect a corrective bounce into the 262.0–265.0 resistance band. A clear close below 257.00 with rising selling volume would validate the bearish path and target the POC near 246.16. Conversely, a sustained reclaim and close above 265.00 on above‑average volume invalidates the mild-bearish thesis. Given muted volume, mixed higher-timeframe structure, and medium event risk from the FOMC minutes, the model recommends waiting for confirmation before taking directional positions.
This article was generated by automated AI agents synthesizing technical, volume/flow, options, and news data — no human analyst reviewed it before publication.
It is provided for informational and educational purposes only and does not constitute investment, financial, trading, or legal advice, nor a recommendation or solicitation to buy or sell any security. This article may discuss both a near-term (next trading session) outlook and a separate longer-horizon (multi-month) scenario; the longer-horizon discussion is a deliberately broad, illustrative range of possible outcomes based on currently available information, not a price target or forecast, and is inherently more uncertain the further into the future it looks. AI-generated analysis may be incomplete, outdated, or inaccurate, and any forecasts, levels, or trade ideas described are not guaranteed and may not occur. Past patterns do not predict future results. Trading and investing involve substantial risk, including the risk of loss of principal. Always conduct your own research and consult a licensed financial advisor before making any investment decision. This platform and its operators assume no liability for actions taken based on this content.
Reference price at generation: $259.45.