MSFT set to test 477.15 intraday support; model flags mild bearish/range bias ahead of FOMC minutes
Prediction model points to an intraday probe of 477.1505 with muted participation and no new trade recommendation until volume/flow confirms a breakout or reclaim.
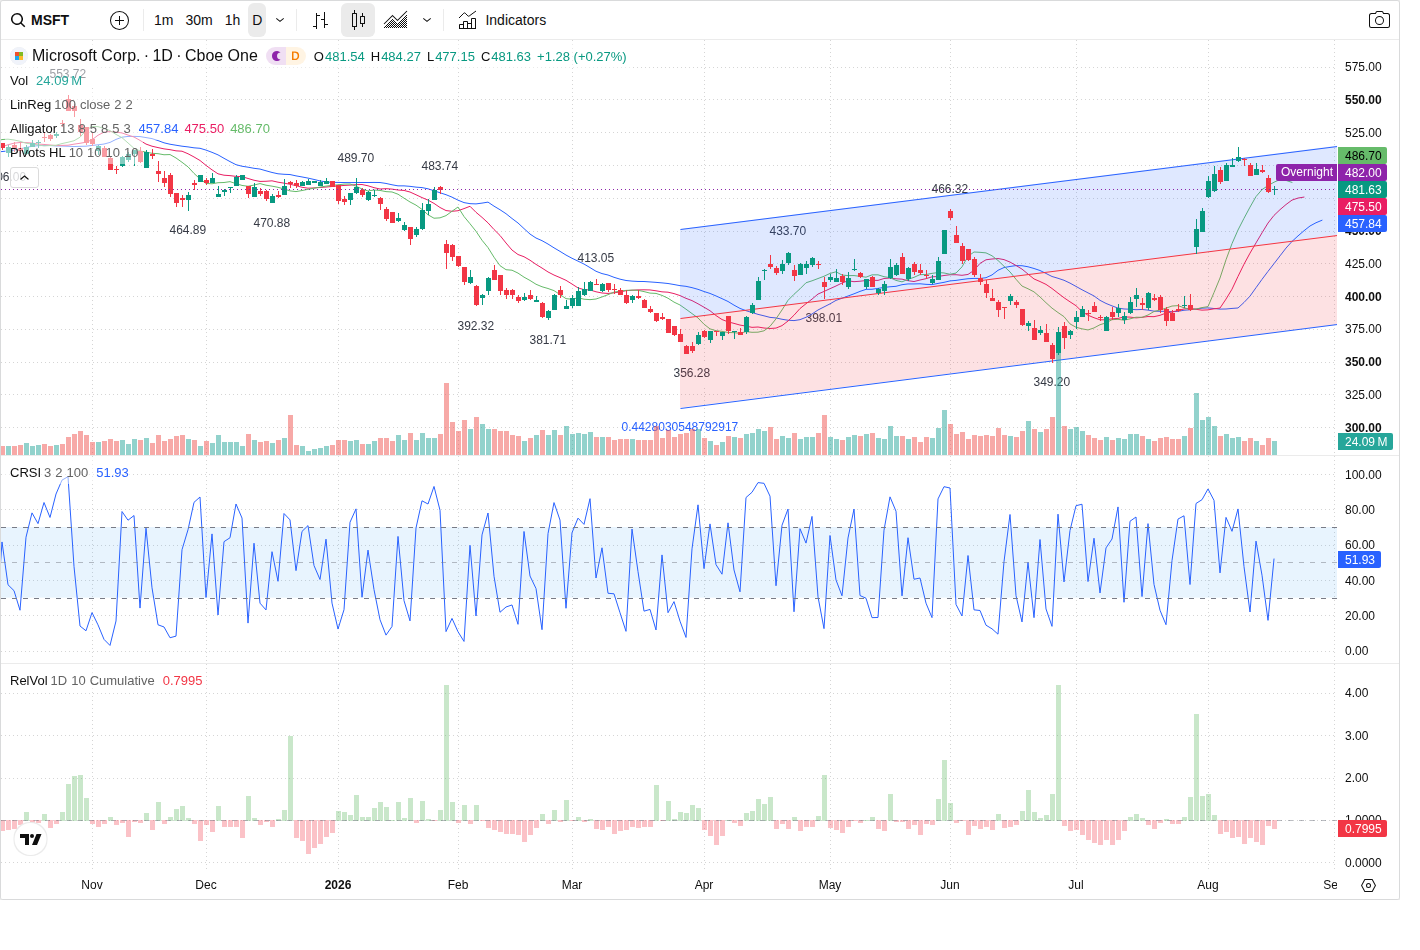
Microsoft (MSFT) is trading at 481.63 in the premarket and the signal for the next session is a mild bearish/range outcome: the highest-probability path is an intraday test of the 477.1505 support zone (476.00–481.00) with range-bound action between ~477 and 485 unless a volume-backed break or reclaim occurs.
Technical picture — multi-timeframe conflict but 5m short pressure
The multi-timeframe read is mixed: the daily trend registers a SHORT bias while the 60‑minute shows LONG/mixed characteristics and the 5‑minute displays a clear LH_LL short structure approaching an entry zone. The model’s primary support is the 5‑minute swing low at 477.1505 (support zone 476.00–481.00). Nearest resistance is identified at 485.0 (zone 485.0–490.0) with secondary resistance at 500.0 and secondary support at 460.0. Bearish confirmation would be a sustained close below 477.1505 on expanding selling volume; bullish confirmation would require a sustained reclaim above ~486.7 on rising participation.
Volume and flow — light participation lowers conviction
Relative volume is low (RVOL ~0.45) with a clear decreasing volume trend; daily session volume is below short-term averages (current 15,031,347 vs 5d avg 19,926,779.8). Micro directional flow shows a small buyer imbalance (buy_pct ~52.97, net imbalance 34,407) and the VFI is positive and rising, while MFI sits bullish at 74.2455. The model notes buyers are present around support but participation is muted — that reduces confidence in taking fresh directional risk without a volume pickup.
Options positioning — short-dated clusters reinforce S/R bands
Options interest clusters align with the technical zones: heavy call OI is concentrated at 500.0 and significant call volume at 485.0 (largest call volume strike). Put OI and volume show elevation at 480.0 and 460.0. The Aug 21 expiry short-dated strikes therefore create a supply band around 485–500 and demand interest near 460–480, reinforcing the model’s primary support (476.00–481.00) and resistance (485.0–490.0) levels.
News & macro drivers — FOMC minutes create medium event risk
Fundamentals remain constructive post-Q4 beat, and the overall news bias is mildly bullish, but macro is the dominant near-term driver. The model flags medium event risk from FOMC minutes (Aug 19), alongside higher Treasury yields and a firmer USD that are near-term headwinds for growth/multiple-sensitive stocks. Given that context, the model assigns a next‑session bias of NEUTRAL-to‑CAUTIOUS and does not favor initiating directional trades absent confirming volume/flow.
Outlook
The most likely path is an opening period of chop or mild weakness that pushes MSFT down to test 477.1505 (476.00–481.00). If buyers demonstrate absorption at that zone (VFI/MFI holding and RVOL rising), expect a failed retest and range-bound action toward 485.0 resistance. If selling expands and price closes decisively below 477.1505 on rising RVOL and negative large-order flow, the model projects continuation toward the secondary support near 460.0. Conversely, a sustained reclaim above ~486.7 on increasing participation would invalidate the mild bearish/range call and target the 500.0 call-cluster. Because of low participation and medium event risk, the model’s trade idea is NO_TRADE (conviction: LOW) until one of those confirmations occurs.
This article was generated by automated AI agents synthesizing technical, volume/flow, options, and news data — no human analyst reviewed it before publication.
It is provided for informational and educational purposes only and does not constitute investment, financial, trading, or legal advice, nor a recommendation or solicitation to buy or sell any security. This article may discuss both a near-term (next trading session) outlook and a separate longer-horizon (multi-month) scenario; the longer-horizon discussion is a deliberately broad, illustrative range of possible outcomes based on currently available information, not a price target or forecast, and is inherently more uncertain the further into the future it looks. AI-generated analysis may be incomplete, outdated, or inaccurate, and any forecasts, levels, or trade ideas described are not guaranteed and may not occur. Past patterns do not predict future results. Trading and investing involve substantial risk, including the risk of loss of principal. Always conduct your own research and consult a licensed financial advisor before making any investment decision. This platform and its operators assume no liability for actions taken based on this content.
Reference price at generation: $481.63.