NVDA seen probing 215.50–217.50 support after modest pullback; options cluster near 228.85 adds near-term resistance
Model flags a mild bearish next session into the VAH/60m support at 216.35, but stops short of a tradable directional call ahead of high event risk.
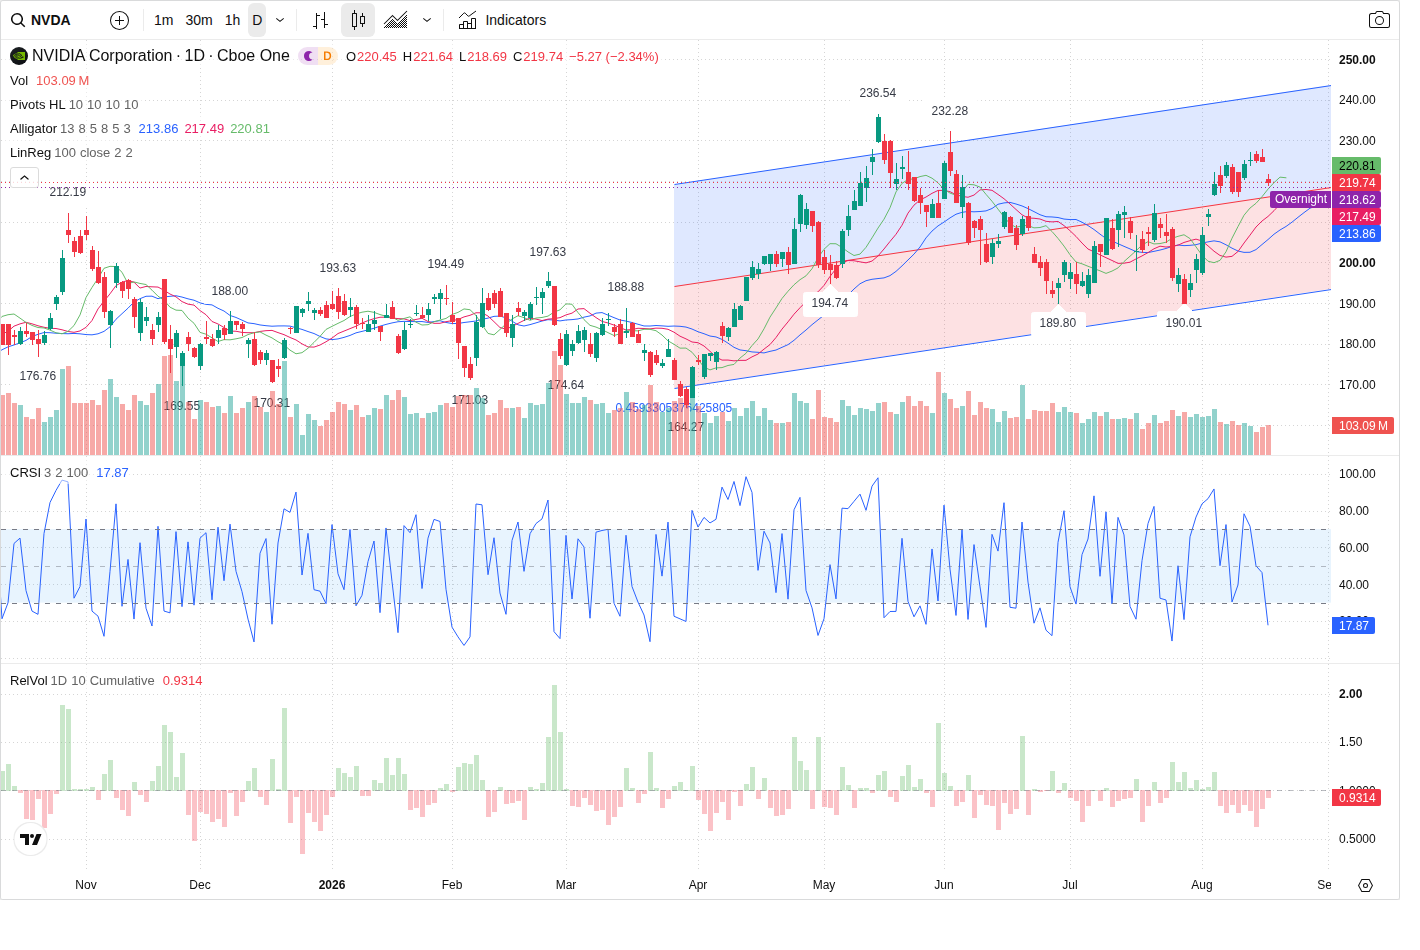
NVIDIA (NVDA) is trading at 219.74 in premarket after a -2.34% session close; the prediction model expects mild bearish pressure tomorrow that will likely test the primary support zone at 215.50–217.50 (VAH 216.35) while advising against initiating new directional trades ahead of FOMC minutes and the busy earnings/macro slate.
Technical picture — uptrend intact but corrective short is active
On the 60‑minute and daily timeframes the underlying trend remains LONG with HH/HL structure intact, but a corrective short is active and price is trading in the lower half of its intraday/60m channel. The Prediction Agent identifies a primary support zone at 215.50–217.50 (Volume Profile VAH at 216.35) and primary resistance clustered at 227.50–231.00 (60m swing highs near 227.92 and an options call OI concentration low at 228.85). Secondary levels to watch are support at the POC 208.385 and daily resistance at 236.54. The most likely short‑term path is an initial probe toward the primary support (~216.35) followed by a shallow recovery into roughly 221–223 if buyers step in.
Volume & flow — mixed participation, seller tilt
Volume is below some longer averages (RVOL ~0.85) while VFI and MFI readings are rising and bullish, suggesting underlying demand. Directional large‑order flow, however, shows a modest seller imbalance (net volume -126,734; sell_pct 51.39) and recent selling increased on the pullback. The model therefore reads participation as mixed: directional pressure that can push price to the 215.50–217.50 buyer zone, but without clear, sustaining buying volume to produce a confident reversal.
Options positioning — call concentration creates near-term supply
Options activity is concentrated in calls at 230 (largest call OI) and heavy near‑term volume at 220/225. The Prediction Agent flags a major positioning zone at 228.85–231.15 driven by large call open interest, which lines up with intraday swing resistance and forms the most probable supply cluster if NVDA tries to rally. Put open interest sits lower (notably 199–201 and put activity at 215 for near expiry), implying that downside acceleration could find structural support closer to the POC at 208.385.
News & macro — elevated event risk limits directional conviction
News bias is mixed but next‑session risk is high: FOMC minutes (Aug 19) are expected to increase intraday volatility and feed into the same week’s higher‑impact prints (PCE Aug 26) and NVDA’s earnings release (Aug 26). The macro backdrop—rising Treasury yields and USD strength—is pressuring expensive growth names and is the principal driver behind today’s ~-2.34% pullback, per the summary. Given this event concentration the model assigns only a 55% prediction confidence and a most likely mild bearish session probability (bearish 45%, bullish 30%, range 25%).
Outlook
The most likely next‑session outcome is a mild bearish session that probes the 215.50–217.50 support cluster, targeting the VAH at 216.35. If that zone holds expect a shallow backtest into roughly 221–223 (intraday high ~223.5). A break and hold below 215.50 with rising selling volume would confirm a move toward the POC at 208.385. Conversely, sustained reclaim and hold above ~228.00 on increased buying volume would be required to restore a bullish continuation toward 236.54. Given the Prediction Agent’s NO_TRADE recommendation and the elevated event risk, the model advises avoiding new directional entries ahead of the FOMC minutes and the coming earnings/macro prints; wait for post‑event structure and participation to clarify direction.
This article was generated by automated AI agents synthesizing technical, volume/flow, options, and news data — no human analyst reviewed it before publication.
It is provided for informational and educational purposes only and does not constitute investment, financial, trading, or legal advice, nor a recommendation or solicitation to buy or sell any security. This article may discuss both a near-term (next trading session) outlook and a separate longer-horizon (multi-month) scenario; the longer-horizon discussion is a deliberately broad, illustrative range of possible outcomes based on currently available information, not a price target or forecast, and is inherently more uncertain the further into the future it looks. AI-generated analysis may be incomplete, outdated, or inaccurate, and any forecasts, levels, or trade ideas described are not guaranteed and may not occur. Past patterns do not predict future results. Trading and investing involve substantial risk, including the risk of loss of principal. Always conduct your own research and consult a licensed financial advisor before making any investment decision. This platform and its operators assume no liability for actions taken based on this content.
Reference price at generation: $219.74.