AMD set to probe 475–480 support after -4.3% drop; model flags mild bearish bias ahead of Jackson Hole and peer earnings
Prediction model expects an early test of the 475–480 buyer zone with resistance into 486–490.5; no directional trade recommended until a 60m reclaim above 490 or a sustained breakdown below 475.
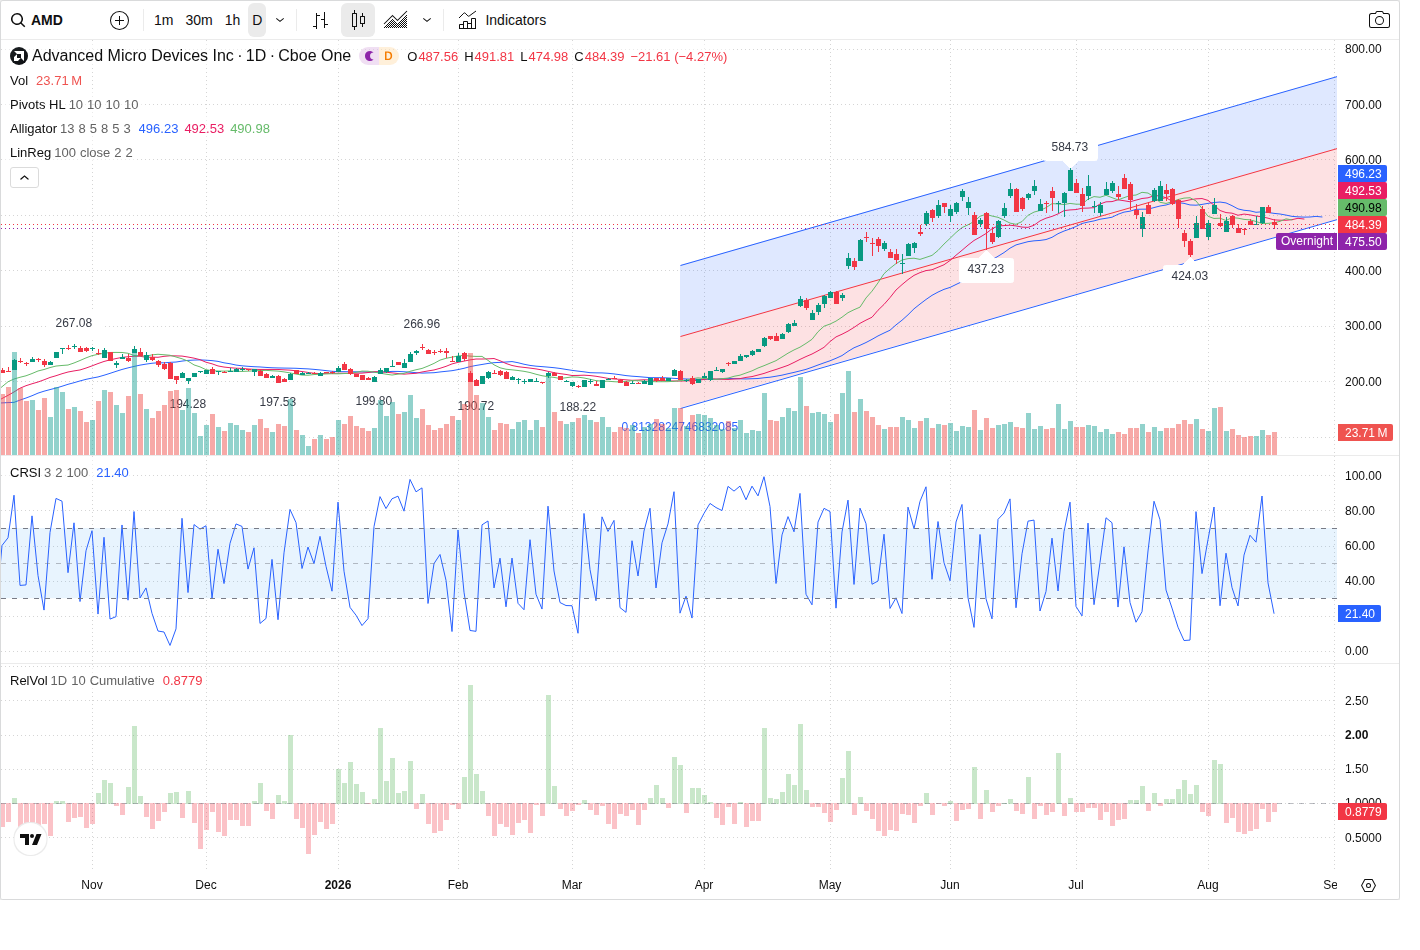
Advanced Micro Devices (AMD) opened the premarket session trading near 484.39 after a -4.27% intraday drop from 506.00; the model’s next-session call is mildly bearish and projects an early probe of the 475–480 support area with limited conviction until event-driven risk around Jackson Hole and major peer earnings resolves.
Technical picture — short-term probe toward value area
The model identifies immediate support at 477.00 (support zone 475.00–480.00), a confluence of recent 5-minute reaction lows and the volume-profile VAL (~477.60). Immediate resistance is defined at 487.64 (zone 486.00–490.50) — the HVN and 60-minute lower trendline area that has capped recent rallies. Secondary technical levels are 456.4 on the downside (daily lower trendline area) and 507.73 as the next resistance/POC above. Daily and 60-minute trends remain technically long overall but both show a corrective short bias; price sits in the lower portion of the rising daily channel and near 60m corrective support.
Volume & flow — light participation but buyer skew
Relative volume is light (RVOL ~0.73) while the VFI is rising and MFI is neutral-to-rising, indicating improving money-flow but below longer-term participation. Directional order-flow shows a buy-side imbalance (buy_pct 54.98%, imbalance 58,531 / 9.96%), and capital-flow metrics show net inflows concentrated in large trades. The model views the sell-off as event-driven with weak participation, which reduces conviction that today’s drop is broad distribution.
Options positioning — resistance into 500, protective puts below 460
Options open-interest clusters reinforce technical levels: large call OI centered at the 500 strike and concentrated put OI near 460. Near-term expiry strikes of note are 480–500, supporting resistance pressure above current price and a protective put band below ~460. The call-heavy OI around 500 aligns with the model’s secondary resistance at 507.73, while put concentrations near 460 support a meaningful downside guard around the 456.4 area if 475 fails.
News & event risk — external drivers dominate
There are no fresh AMD-specific catalysts in the past 48–72 hours; the decline looks largely driven by macro and sector events. The news agent labels event risk as HIGH — Jackson Hole Fed commentary and upcoming major peer earnings (notably NVIDIA) are the top short-term catalysts. The model assigns a next-session bias of MILD_BEARISH and prediction confidence of 60% given the elevated probability that yields, rate-speech tone, or peer guidance can rapidly re-price AI/semiconductor multiple expectations.
Outlook
Most likely path: an early test of the 475–480 buyer zone (possible probe toward the model’s expected intraday low ~472.00). If buyers defend 475–480 price should attempt a bounce into the 486–490.5 HVN/POC area where selling pressure is likely to cap gains. Failure to hold 475 on 30–60m follow-through would confirm a bearish path toward the daily lower trendline area (~456.4). Bullish confirmation requires a sustained reclaim and 60-minute close above 490.00; bearish confirmation requires a clear breakdown and hold below 475.00 on intraday follow-through (increased selling RVOL). Given light participation today and elevated event risk the model’s trade idea is NO_TRADE — wait for one of those confirmations before taking a directional position.
This article was generated by automated AI agents synthesizing technical, volume/flow, options, and news data — no human analyst reviewed it before publication.
It is provided for informational and educational purposes only and does not constitute investment, financial, trading, or legal advice, nor a recommendation or solicitation to buy or sell any security. This article may discuss both a near-term (next trading session) outlook and a separate longer-horizon (multi-month) scenario; the longer-horizon discussion is a deliberately broad, illustrative range of possible outcomes based on currently available information, not a price target or forecast, and is inherently more uncertain the further into the future it looks. AI-generated analysis may be incomplete, outdated, or inaccurate, and any forecasts, levels, or trade ideas described are not guaranteed and may not occur. Past patterns do not predict future results. Trading and investing involve substantial risk, including the risk of loss of principal. Always conduct your own research and consult a licensed financial advisor before making any investment decision. This platform and its operators assume no liability for actions taken based on this content.
Reference price at generation: $484.39.