SPY seen testing 761–764 support into PCE; failure risks slide to volume POC near 749.80
Model: mild bearish bias for the next session with no trade recommendation until post‑data confirmation; primary intraday zone 761.0–764.0, immediate resistance 770.0–773.0.
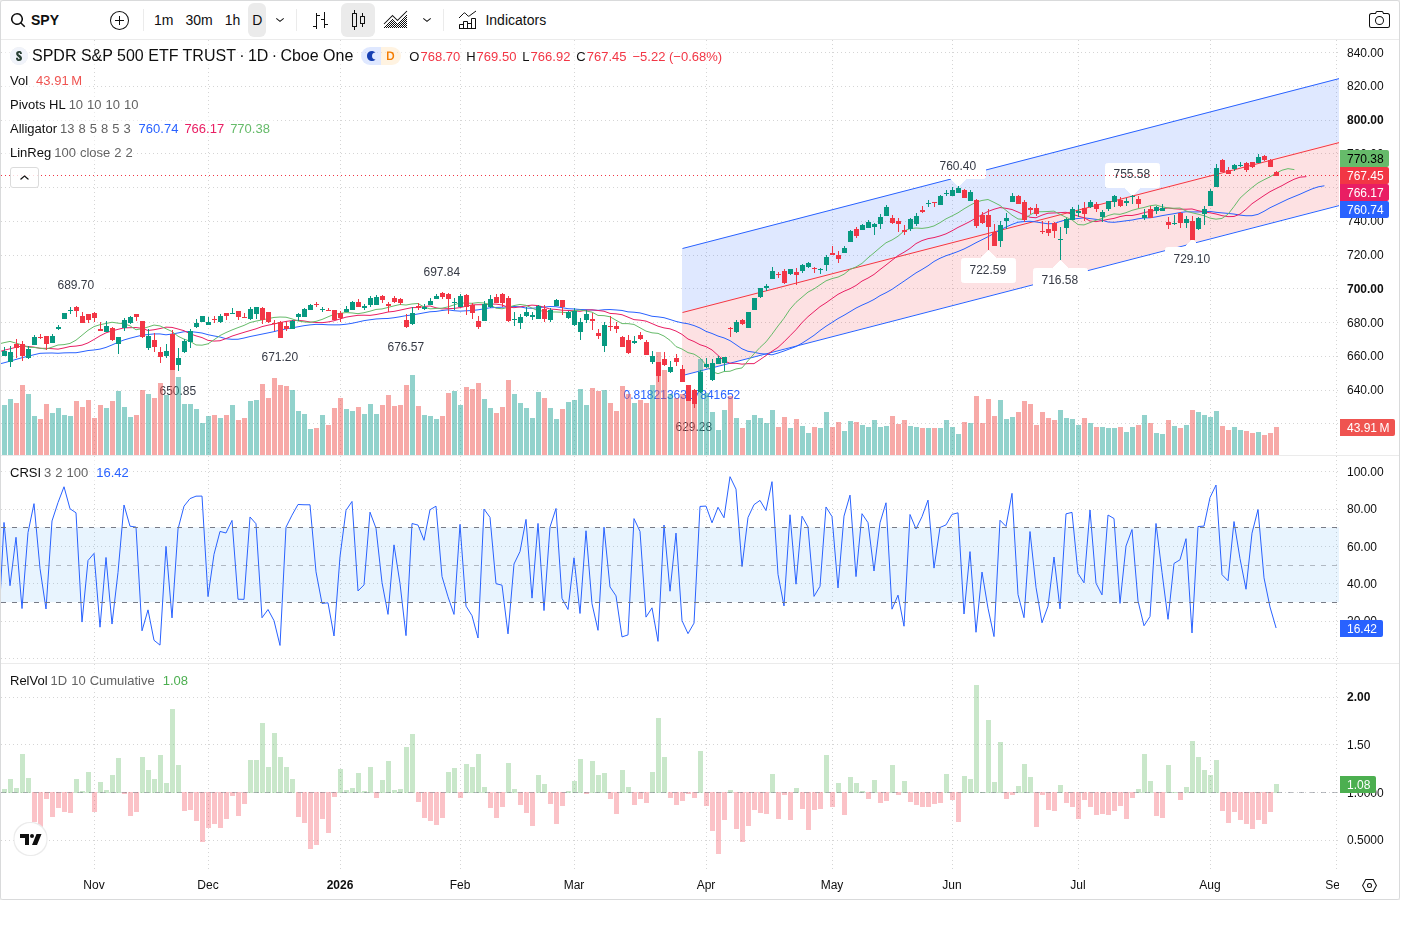
SPY opened the premarket near 767.45 (prev. close 772.67) and the model expects early weakness into the 761.00–764.00 support zone next session; a clear break below that zone would put the ETF on a path toward the volume point-of-control at 749.7970833333334.
Technical picture — short bearish, longer-term constructive
The prediction agent labels the next session MILD_BEARISH (60% confidence) with probabilities: bullish 25%, range 30%, bearish 45%. Shorter timeframes show corrective short pressure inside an overall long channel: 60m and daily trends remain LONG (trend strength 100), but a corrective leg is active and 5m structure is down-channel. The primary intraday support zone is 761.0–764.0 (support price 762.5). Immediate overhead resistance is 770.0–773.0 (resistance price 770.0). Secondary levels cited are support at the volume POC 749.7970833333334 and secondary resistance at 776.81. The model’s preferred path: open near 767, test the 762 zone, hold and bounce toward 770–773 or, on a break, roll down toward ~749.80.
Volume and order flow — buyers present but not dominant
Intraday participation was mixed: RVOL around 0.90, end‑of‑day volume increased to 34,454,392 (above the 5‑day avg by 25.52% but below the 20‑day avg). VFI is above zero and recently rising; MFI is bullish (~71) and directional flow slightly favors buyers (buy_pct 52.11, imbalance 104,853). The prediction agent notes that buyers remain present but were insufficient to prevent the corrective leg — a decisive bearish confirmation requires a close below 761.00 on rising selling volume (RVOL > 1).
Options and positioning — short-term pin near 770, protective puts deeper
Options data point to concentrated call open interest around 776–783 and a call OI peak at 780.0; the 770.0 strike shows heavy intraday call and put volume and is flagged as immediate overhead congestion. The overall OI put/call ratio is ~1.26 driven by larger put blocks at lower strikes (notably 720.0). The model highlights that call OI near 770–780 can act as resistance/pin while the larger put interest deeper (720–730) provides structural downside protection but is too far below current price to prevent a move to the POC near 749.80 if the primary zone fails.
Macro and event risk — PCE and Philly Fed loom large
News flow is the dominant driver: event_risk is HIGH for tomorrow’s PCE deflator (Jul) and Philly Fed manufacturing index (Aug 19). The prediction agent frames the recent pullback as orderly profit‑taking ahead of these prints rather than an index‑specific shock. Because stronger inflation or resilient labor data could revive terminal rate expectations, the model reduces conviction and recommends waiting for post‑data confirmation before taking directional risk.
Outlook
Most likely next session: mild bearish pressure with an intraday test of 761.0–764.0. If that zone holds, expect a contained bounce toward 770.0–773.0; if price breaks and closes below 761.0 on rising selling volume, the next realistic target is the volume POC at 749.7970833333334. Bullish confirmation requires a clean reclaim and hold above 770.0 on rising volume; bearish confirmation is a close below 761.0 with RVOL >1 and 60m follow‑through. The prediction agent’s trade idea is NO_TRADE (conviction LOW) — wait for post‑event directional confirmation before establishing positions.
This article was generated by automated AI agents synthesizing technical, volume/flow, options, and news data — no human analyst reviewed it before publication.
It is provided for informational and educational purposes only and does not constitute investment, financial, trading, or legal advice, nor a recommendation or solicitation to buy or sell any security. This article may discuss both a near-term (next trading session) outlook and a separate longer-horizon (multi-month) scenario; the longer-horizon discussion is a deliberately broad, illustrative range of possible outcomes based on currently available information, not a price target or forecast, and is inherently more uncertain the further into the future it looks. AI-generated analysis may be incomplete, outdated, or inaccurate, and any forecasts, levels, or trade ideas described are not guaranteed and may not occur. Past patterns do not predict future results. Trading and investing involve substantial risk, including the risk of loss of principal. Always conduct your own research and consult a licensed financial advisor before making any investment decision. This platform and its operators assume no liability for actions taken based on this content.
Reference price at generation: $767.45.