QQQ set to test 704–711 buyer zone after premarket gap; PCE print raises short-term downside risk
Model flags a mild bearish session: expect weakness toward the 709/704 area with no pre-PCE directional trade — watch 724.66 reclaim or break below 709 to confirm the next leg.
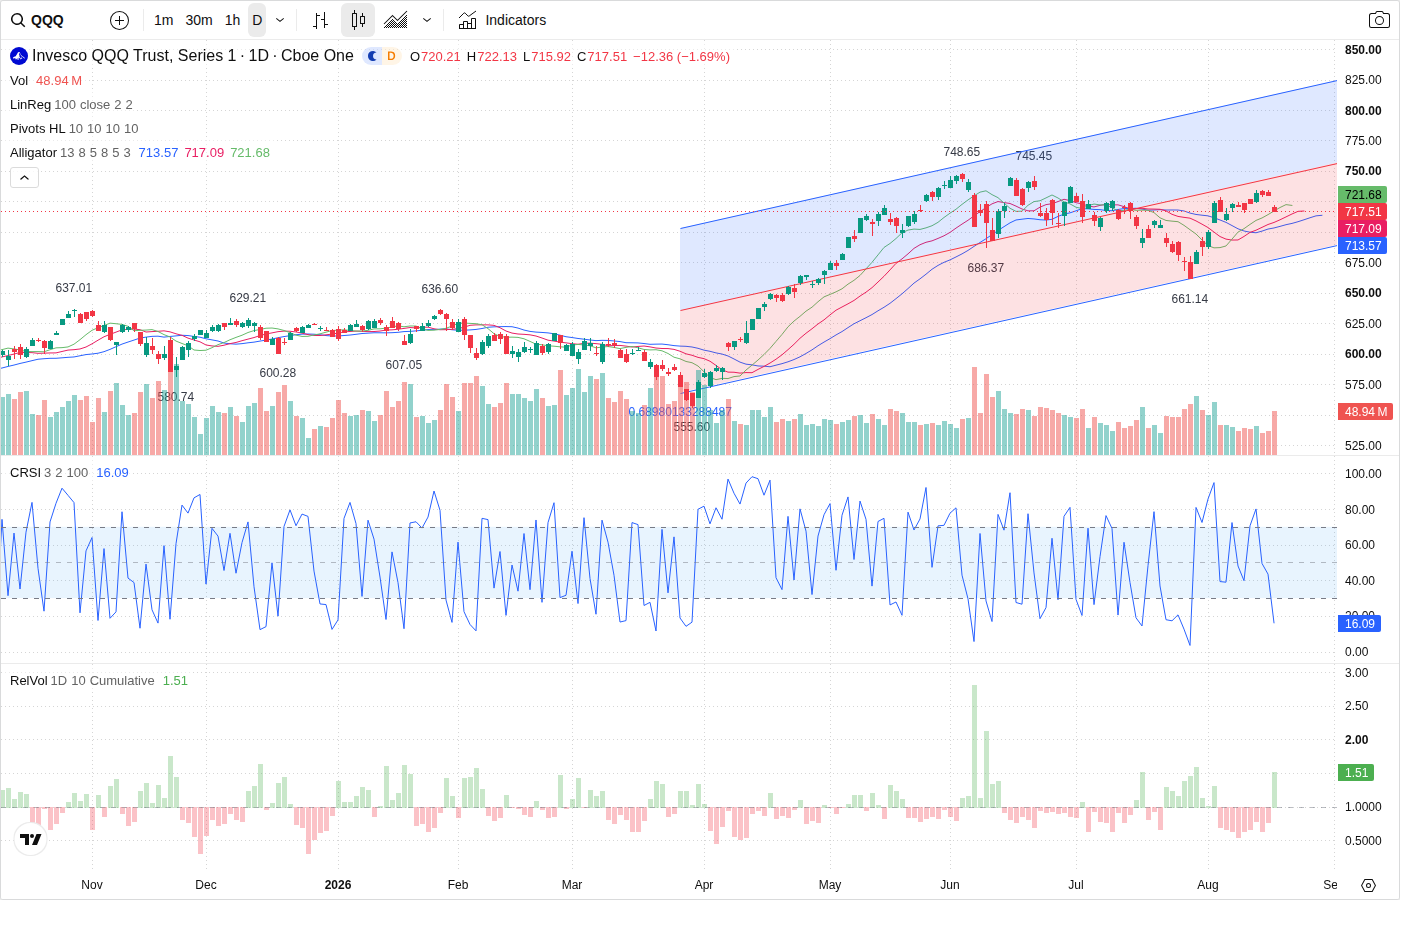
QQQ is trading at 717.51 in the premarket after a gap lower from 729.87, and the prediction model sees the next session tilting mildly bearish. The most important near-term action is whether price finds support into the 704–711 buyer zone or breaks below 709 on rising selling volume following the US PCE print.
Technical picture — channelled uptrend with a corrective short
On the 60-minute and daily frames the dominant trend remains a longer-term up-channel, but short-term structure is corrective: the 60m chart shows a LH/LL corrective leg and price sitting in the lower half of the channel. The model identifies primary support as a clustered technical/options zone centered on 709.0 (zone 704.0–711.0) and primary resistance at 724.66 (zone 724.0–731.0). Secondary levels are 661.14 (support) and 748.63 (resistance). The prediction calls a down move toward an expected close of 710.0 with an expected intraday low around 703.0 and high near 725.0.
Volume, flow and options — buyers showing episodic demand amid heavy put interest
Intraday participation is elevated (RVOL ~1.32) and the VFI remains above zero while MFI is bullish, with directional order flow showing buyer-initiated prints (buy_pct ~74.31) during the decline — a sign of episodic buying into weakness rather than conviction to reverse. Options positioning, however, is skewed toward puts: total_put_volume (101,006) exceeds calls and the volume PCR is ~1.34; put OI is also larger (oi_put_call_ratio ~1.17). Important short-dated strikes concentrate interest around 700–710 (heavy put volume at 700 expiry Aug 21 and large put OI at 680), which supports the 704–711 buyer zone and creates a nearby floor that could attract defensive flows.
Macro and event risk — PCE and yields driving session bias
News flow is the dominant catalyst: the PCE deflator release (Aug 19 ~08:30 ET) and related Fed commentary are flagged as high event risk and tilt the next session mildly bearish. The market backdrop — drifting higher Treasury yields, firmer oil and recent weakness in AI/mega-cap names — increases the chance of multiple compression for growth-heavy QQQ. Prediction confidence is moderate (60), and the model explicitly recommends avoiding directional entries ahead of the print because outcomes can quickly flip intraday.
Session trade plan — wait for confirmation, trade edges if range
The model's recommended posture is no trade ahead of PCE (trade_idea.direction = NO_TRADE, conviction LOW). It defines clear confirmations: bullish confirmation is a sustained reclaim above 724.66 with rising volume/RVOL >1 and positive large-order flow; bearish confirmation is a break-and-hold below 709.0 on increased selling volume with follow-through into 704–700. If price instead chops between the primary support zone (704.0–711.0) and resistance band (724.0–731.0), expect low-momentum swings and an edge strategy of buying near the 709 reference with tight stops below 704 and selling near 724–731 until a breakout provides clarity.
Outlook
Most likely path is early weakness into the 709–704 buyer zone or a nearby intraday low (~703–709) as the market processes PCE and Fed-speak; a brief bounce toward 724 is possible if buyers stabilize but conviction requires a sustained reclaim above 724.66. Conversely, a confirmed break below 709 on rising selling volume would open a multi-session extension toward the secondary support at 661.14. Given the HIGH event risk and mixed structure, wait for post-print structure and volume confirmation before taking directional positions.
This article was generated by automated AI agents synthesizing technical, volume/flow, options, and news data — no human analyst reviewed it before publication.
It is provided for informational and educational purposes only and does not constitute investment, financial, trading, or legal advice, nor a recommendation or solicitation to buy or sell any security. This article may discuss both a near-term (next trading session) outlook and a separate longer-horizon (multi-month) scenario; the longer-horizon discussion is a deliberately broad, illustrative range of possible outcomes based on currently available information, not a price target or forecast, and is inherently more uncertain the further into the future it looks. AI-generated analysis may be incomplete, outdated, or inaccurate, and any forecasts, levels, or trade ideas described are not guaranteed and may not occur. Past patterns do not predict future results. Trading and investing involve substantial risk, including the risk of loss of principal. Always conduct your own research and consult a licensed financial advisor before making any investment decision. This platform and its operators assume no liability for actions taken based on this content.
Reference price at generation: $717.51.