BAC setup: short correction into 63.50–64.00 with resistance clustered at 65.22; model recommends no trade into CPI/FOMC day
Prediction model sees a constrained down session — test of 63.81 support then a likely finish near ~63.20 — but reversal is unconfirmed and event risk keeps conviction low.
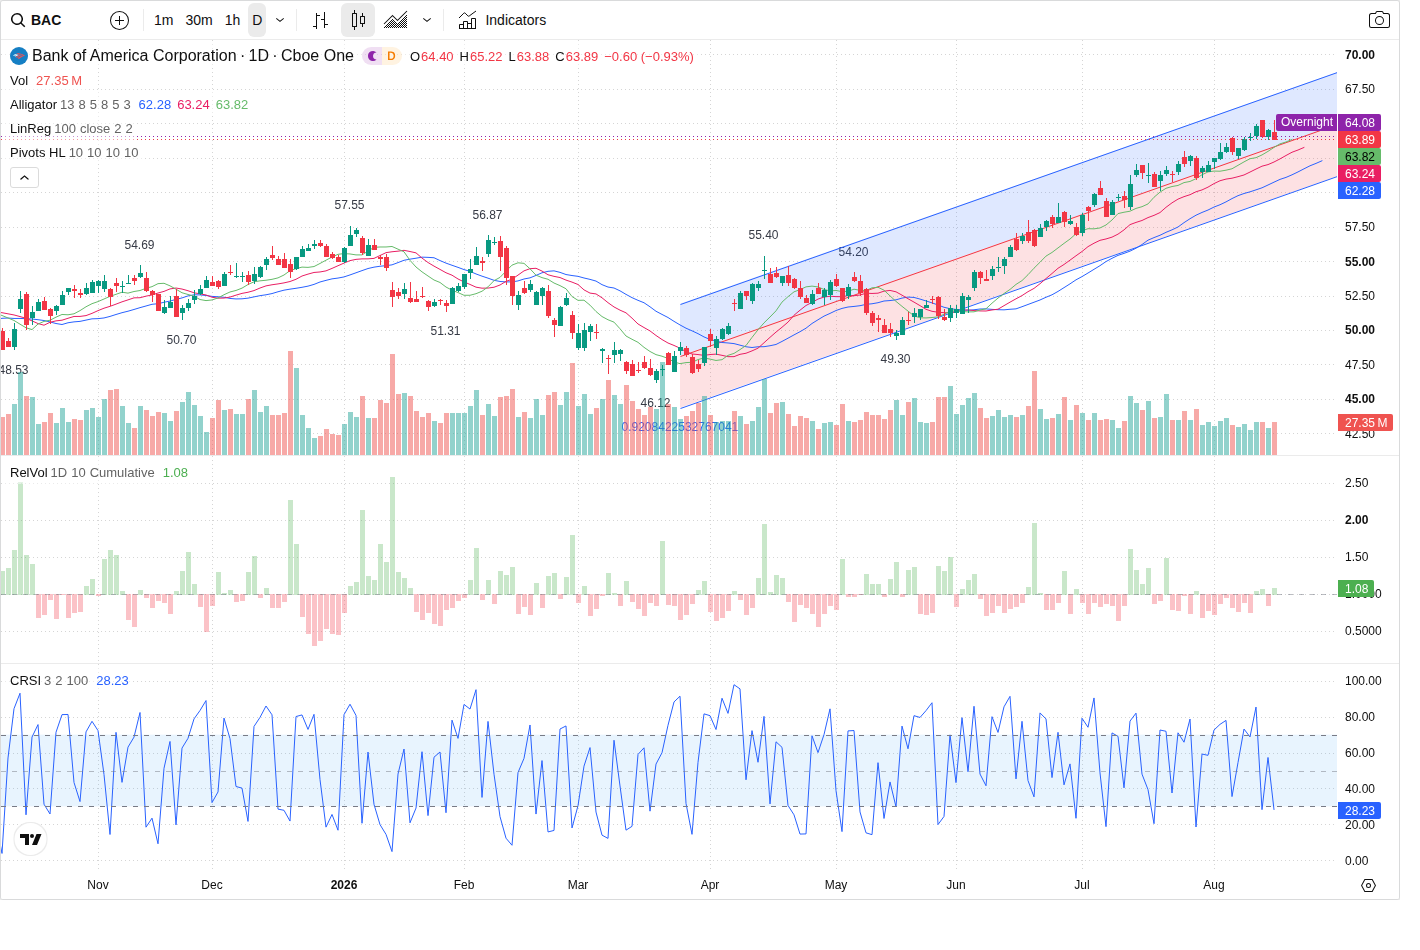
Bank of America (BAC) is trading around 63.89 in the premarket after a modest pullback; the prediction model expects early weakness to probe the immediate corrective support zone at 63.50–64.00 (primary support 63.81) and forecasts a session close near 63.20, but it flags reversal as unconfirmed and recommends no new directional trade ahead of FOMC minutes and July CPI.
Technical picture
Across timeframes the backdrop is a corrective pullback inside a broader constructive trend. The 5-minute frame shows the earlier HH_HL structure but a corrective breakdown toward the 5-minute swing low at 63.81; that level is defined as the primary short-term support. The 60-minute and daily frames remain technically bullish overall but are labeled in the packet as 'correction_active' — the model therefore classifies the next-session trend as mild_bearish with a 60% confidence level. Key levels to watch are primary support 63.81 (zone 63.50–64.00) and primary resistance 65.225 (zone 65.00–65.50). Secondary support lines up with the volume POC at 61.26541666666666 and a secondary resistance at 66.0.
Volume and capital flow
Liquidity is slightly elevated: RVOL ~1.06 with current volume 22,575,062 vs shorter-term averages. Intraday order flow favours sellers (buy_pct 40.6 / sell_pct 59.4; net large-order outflow ~ -9,405,165 on the capital-flow sample). VFI remains above zero but is falling; MFI sits bullish at 69.67 and is rising. The packet’s summary reads: increasing relative volume with seller dominance — a distributionary signature that supports the short-correction view unless buy-side volume and VFI improve.
Options and volatility
Options positioning reinforces the resistance band near 65. The largest call OI is concentrated at the 65 strike and the predictive agent highlights a major call-OI zone 64.675–65.325. Put OI concentration sits around 60 (zone 59.7–60.3) and would act as a structural magnet if a larger sell-off unfolds. IV sits at 0.2026, HV at 0.15317 (IV/HV ratio ~1.323), indicating modestly elevated implied skew but no extreme volatility premium. Notably near-term volume showed heavy put flow at the 64 strike, which aligns with short-term seller interest around current prices.
News, macro and event risk
Fundamentals are supportive: solid Q2 results, a dividend increase and a $40B buyback authorization underpin a mild bullish medium-term bias. Near term, however, event risk is elevated: FOMC minutes and July CPI fall on Aug 18. The Prediction Agent flags these as medium event risk that could move Treasury yields and bank sensitivity to NII, increasing intraday volatility and reducing directional edge for the session. The packet assesses this risk as partially priced but still disruptive for short-term trading.
Outlook
The most likely path is early weakness testing the 63.50–64.00 support (primary 63.81), a possible short rebound toward 65.00–65.22, and a session finish modestly lower near ~63.20 (predicted change -1.06%, expected_close 63.2). Bearish confirmation for a momentum move would be a break and sustained trade below 63.50 accompanied by expanding selling volume (RVOL > 1.0 and continued large-order outflow), which opens the volume-POC area at 61.26541666666666. Bullish confirmation would require a sustained reclaim and hold above 64.50 on increasing buy volume and improving VFI. Given the unconfirmed reversal, seller-dominated flow and same-day macro releases, the model’s trade idea is NO_TRADE (conviction: LOW) until a clean reclaim or decisive breakdown provides a higher-probability edge.
This article was generated by automated AI agents synthesizing technical, volume/flow, options, and news data — no human analyst reviewed it before publication.
It is provided for informational and educational purposes only and does not constitute investment, financial, trading, or legal advice, nor a recommendation or solicitation to buy or sell any security. This article may discuss both a near-term (next trading session) outlook and a separate longer-horizon (multi-month) scenario; the longer-horizon discussion is a deliberately broad, illustrative range of possible outcomes based on currently available information, not a price target or forecast, and is inherently more uncertain the further into the future it looks. AI-generated analysis may be incomplete, outdated, or inaccurate, and any forecasts, levels, or trade ideas described are not guaranteed and may not occur. Past patterns do not predict future results. Trading and investing involve substantial risk, including the risk of loss of principal. Always conduct your own research and consult a licensed financial advisor before making any investment decision. This platform and its operators assume no liability for actions taken based on this content.
Reference price at generation: $63.89.