TSLA eyes 337.24 support as 60m/daily downtrend keeps upside capped near 345–350
Model flags a mild bearish next session: early test of 337.24 likely, with a break exposing 334.54; no confirmed reversal so the prediction agent withholds a trade idea.
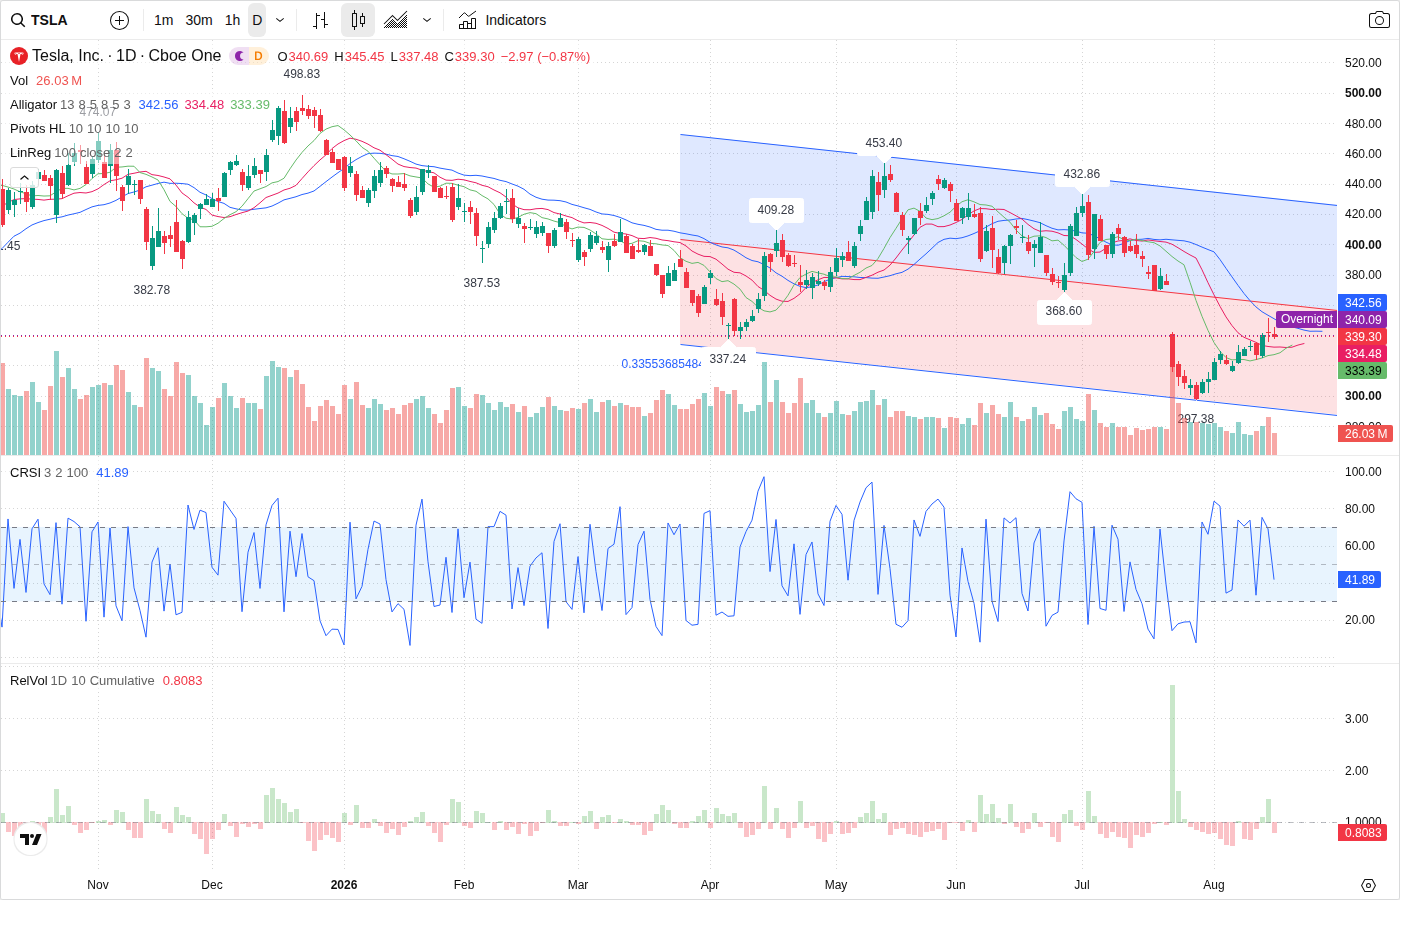
Tesla (TSLA) is trading near 339.30 in the premarket with the near-term picture skewed toward a mild bearish session. The prediction model expects an early probe of the primary support area at 337.24 (zone 336.00–338.50); failure there would target the 60‑minute lower trendline at 334.54 while a reclaim above 346 would be required to flip the bias.
Technical picture — mixed intraday, dominant higher‑timeframe short bias
On the 5‑minute frame the short-term trend shows mixed structure but identifies micro‑support around 337.49; that aligns with the daily nearest swing low at 337.24, which the model treats as the primary support. The 60‑minute and daily frames remain in defined short trends (LH/LL on 60m, corrective long within a larger down channel on daily). Primary resistance is placed at 345.00 (zone 343.00–346.75) with secondary resistance at 350.00 tied to concentrated call interest. The prediction’s expected close for the next session is 335.00 (expected change -1.27%), with an expected intraday range down to 332.00 and up to 346.00 if upside attempts appear.
Volume and money flow — muted participation, order flow favors sellers
Participation is below recent averages: RVOL ≈ 0.656 with current session volume 24,324,356 versus higher multi‑day averages. VFI is negative but rising and MFI sits bullish at 68.32, indicating money remains present but mixed beneath the surface. Directional flow shows a net selling imbalance of -76,759 (sell side 53.31%), and capital‑flow metrics record net outflows concentrated in large orders. Taken together the volume picture provides only partial support for a bullish reversal — it more strongly confirms the prediction’s mild bearish tilt and the possibility of a degrading test of primary support.
Options positioning — clear bands shaping intraday ceilings and floors
Near‑term option interest clusters matter: large put open interest at the 340 strike and large call open interest at 350. Important short‑term resistance is identified in the 343–346 area, supported by call activity (notably the large OI at 350) and the call‑heavy 350 zone. The 338.3–341.7 band also represents a put OI concentration that helps define the immediate trading range. The options map therefore reinforces the model’s resistance and secondary resistance levels and the asymmetric path where reclaiming above the 346 zone would be required to shift momentum.
News & event risk — mixed fundamentals, Fed minutes keep event sensitivity elevated
The news backdrop is mixed. Company‑level fundamentals (Q2 results, AI/autonomy investments, delivery momentum) are largely priced in, but regulatory overhang (NHTSA/ODI audits) and macro pressure from rising Treasury yields and oil leave a mild bearish bias. The prediction agent flags medium event risk from upcoming Fed minutes midweek — that increases the chance of event‑driven intraday volatility and weakens the case for taking an unconfirmed reversal trade ahead of potential rate‑sensitive moves.
Outlook
The most likely next‑session path is an early test of the primary support zone around 337.24; if that level holds expect choppy trading between ~337 and 345 with weak upside attempts. More probable, given seller‑biased order flow and muted volume, is a degradation through 337.24 toward the 60‑minute lower trendline at 334.54. A sustained reclaim above ~346.00 on improving volume would invalidate the bearish tilt and open targets toward the 350 call‑interest zone, but the model explicitly withholds a trade idea (NO_TRADE) until a reversal is confirmed.
This article was generated by automated AI agents synthesizing technical, volume/flow, options, and news data — no human analyst reviewed it before publication.
It is provided for informational and educational purposes only and does not constitute investment, financial, trading, or legal advice, nor a recommendation or solicitation to buy or sell any security. This article may discuss both a near-term (next trading session) outlook and a separate longer-horizon (multi-month) scenario; the longer-horizon discussion is a deliberately broad, illustrative range of possible outcomes based on currently available information, not a price target or forecast, and is inherently more uncertain the further into the future it looks. AI-generated analysis may be incomplete, outdated, or inaccurate, and any forecasts, levels, or trade ideas described are not guaranteed and may not occur. Past patterns do not predict future results. Trading and investing involve substantial risk, including the risk of loss of principal. Always conduct your own research and consult a licensed financial advisor before making any investment decision. This platform and its operators assume no liability for actions taken based on this content.
Reference price at generation: $339.30.