AMZN expected to probe 260 tomorrow; model flags higher odds of a shallow sell-off with options cluster capping rallies
Prediction model sees a mild bearish session: an early test of 259–261 with the path skewed down unless a clean reclaim above 271 appears.
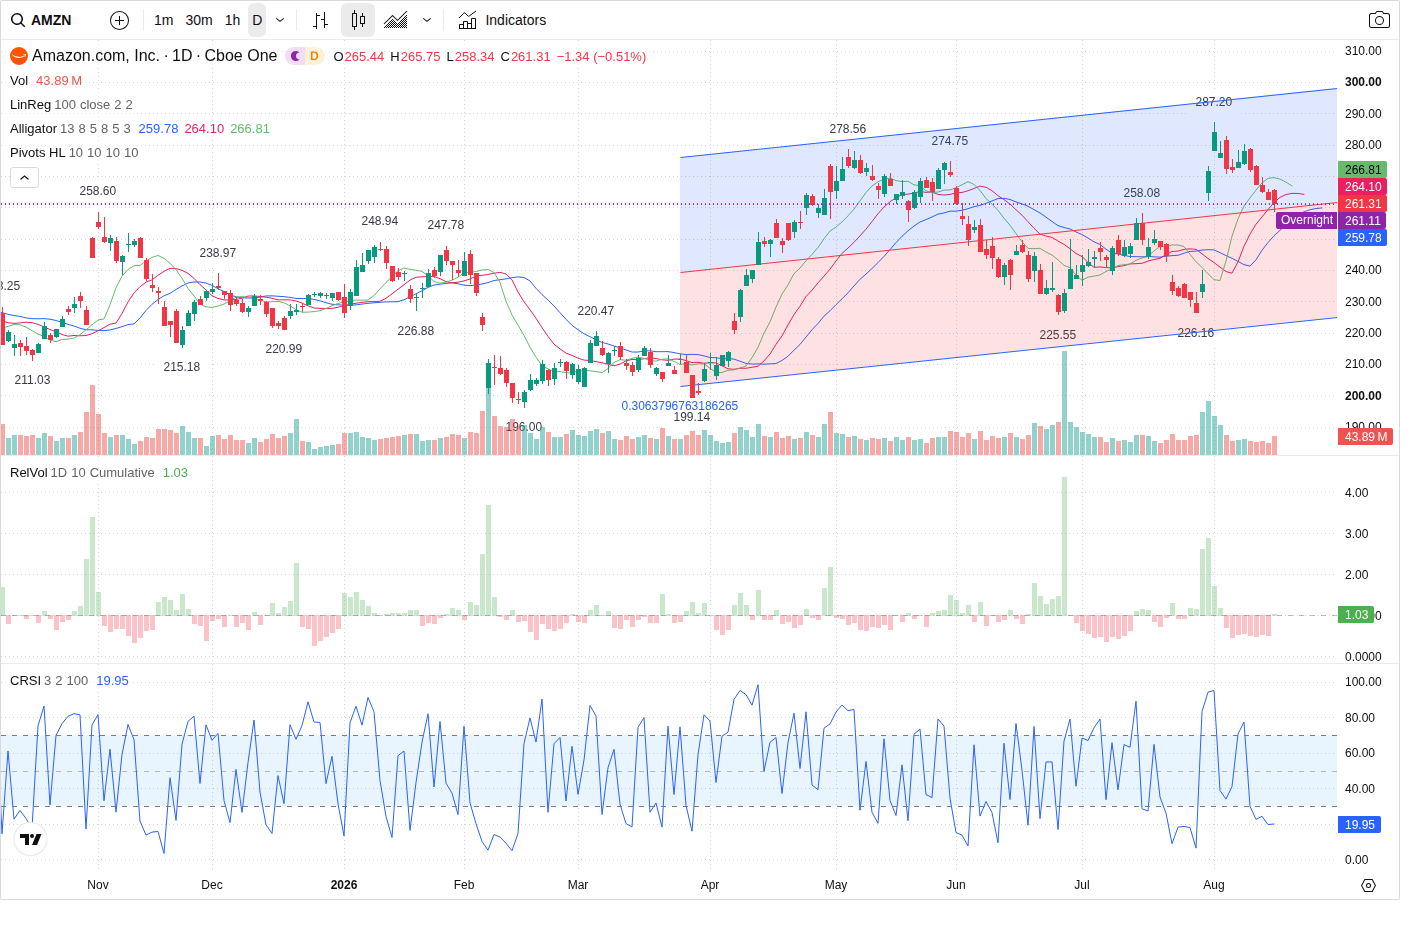
Amazon shares are sitting at 261.31 in premarket trade after a small intraday pullback; the Prediction Agent rates the next regular session MILD_BEARISH (60% confidence) and expects an early probe of the 259–261 primary support zone with a greater probability of a stall or extension lower than an immediate breakout higher.
Technical picture — mixed multi‑timeframe structure
The model labels the multi‑timeframe structure as mixed: daily and 60‑minute trends remain long but are in a short corrective phase, while the 5‑minute shows a corrective short inside a downward intraday channel. Primary intraday support is the 259.00–261.00 zone (model support price 260.00) and the nearest resistance cluster sits at 265–271 with the important 270 strike noted. Secondary technical anchors are the volume POC at 246.16217708333335 and the daily swing resistance at 278.56. The predicted session path calls for an early test of the 260 area; if that holds, a shallow rebound into 264–268 is likely but expected to stall below the 268–271 option/call cluster.
Volume & money flow — participation mixed, buyers visible but large‑order outflows persist
Intraday relative volume is slightly below average (RVOL ~0.94) and the session saw a volume uptick (current volume 40,226,456) but overall the short‑term volume trend is decreasing. VFI is positive and rising — a signal that buyers are present into lower prices — while directional tape shows a mild seller edge (buy_pct 49 / sell_pct 51; net imbalance -21,830). Capital flow across large orders is net negative (large order net ≈ -5,562,229), indicating institutional outflow pressure. The Prediction Agent therefore treats participation as mixed: lower overall participation reduces conviction for a reversal, even though VFI suggests some buying interest around the lows.
Options positioning — asymmetric friction at both sides
Options activity is call‑heavy (total_call_volume 125,458 vs total_put_volume 37,939; vol put/call ~0.30) and open interest concentrates calls near 270 (largest call OI strike 270.0) while put interest sits nearer 250. Notable strikes for the week include 270 (large call OI and highest call volume), 260 (significant volume split with both calls and puts), and 250 (largest put OI). The model flags two major positioning zones: 268.65–271.35 (call cluster, creates resistance) and 248.75–251.25 (put cluster, creates backstop lower). In short, options position density is likely to cap rebounds around the high‑260s and provide modest support around 260.
News & macro context — company beats but macro pressure keeps bias guarded
Company fundamentals remain a mild tailwind: Q2 showed strong top‑line and AWS/AI acceleration that the news engine assesses as MILD_BULLISH. The macro backdrop, however, is a headwind — 10‑year yields have backed up (~4.7%) and FOMC minutes due Aug 19 represent medium event risk for growth names. The Prediction Agent rates next‑session news risk as MEDIUM and judges that the bullish company narrative does not override the short‑term corrective technicals and mixed flow data.
Outlook
Most likely next‑session path is a short‑biased probe of the 259–261 zone. If 259–261 holds, expect a muted bounce into roughly 264–268 that will probably stall below the 268–271 call cluster. The bearish alternate is a break and hold below 259.00 on expanding selling volume and negative large‑order net flow, which would open an extension toward the secondary support/POC at 246.16217708333335. The setup is not recommended for a directional entry now (trade idea: NO_TRADE, conviction LOW); the model requires either a sustained reclaim above 271.00 on rising volume (bullish confirmation) or a clean break and failed reclaim of 259.00 (bearish confirmation) before signaling a trade.
This article was generated by automated AI agents synthesizing technical, volume/flow, options, and news data — no human analyst reviewed it before publication.
It is provided for informational and educational purposes only and does not constitute investment, financial, trading, or legal advice, nor a recommendation or solicitation to buy or sell any security. This article may discuss both a near-term (next trading session) outlook and a separate longer-horizon (multi-month) scenario; the longer-horizon discussion is a deliberately broad, illustrative range of possible outcomes based on currently available information, not a price target or forecast, and is inherently more uncertain the further into the future it looks. AI-generated analysis may be incomplete, outdated, or inaccurate, and any forecasts, levels, or trade ideas described are not guaranteed and may not occur. Past patterns do not predict future results. Trading and investing involve substantial risk, including the risk of loss of principal. Always conduct your own research and consult a licensed financial advisor before making any investment decision. This platform and its operators assume no liability for actions taken based on this content.
Reference price at generation: $261.31.