Meta (META) drifts lower into 558–568 value band; POC at 595.20 remains primary resistance
Model flags a mild bearish bias for the next session with a likely test of the 558–568 support cluster; no directional trade recommended as order flow and options positioning conflict with the technical short.
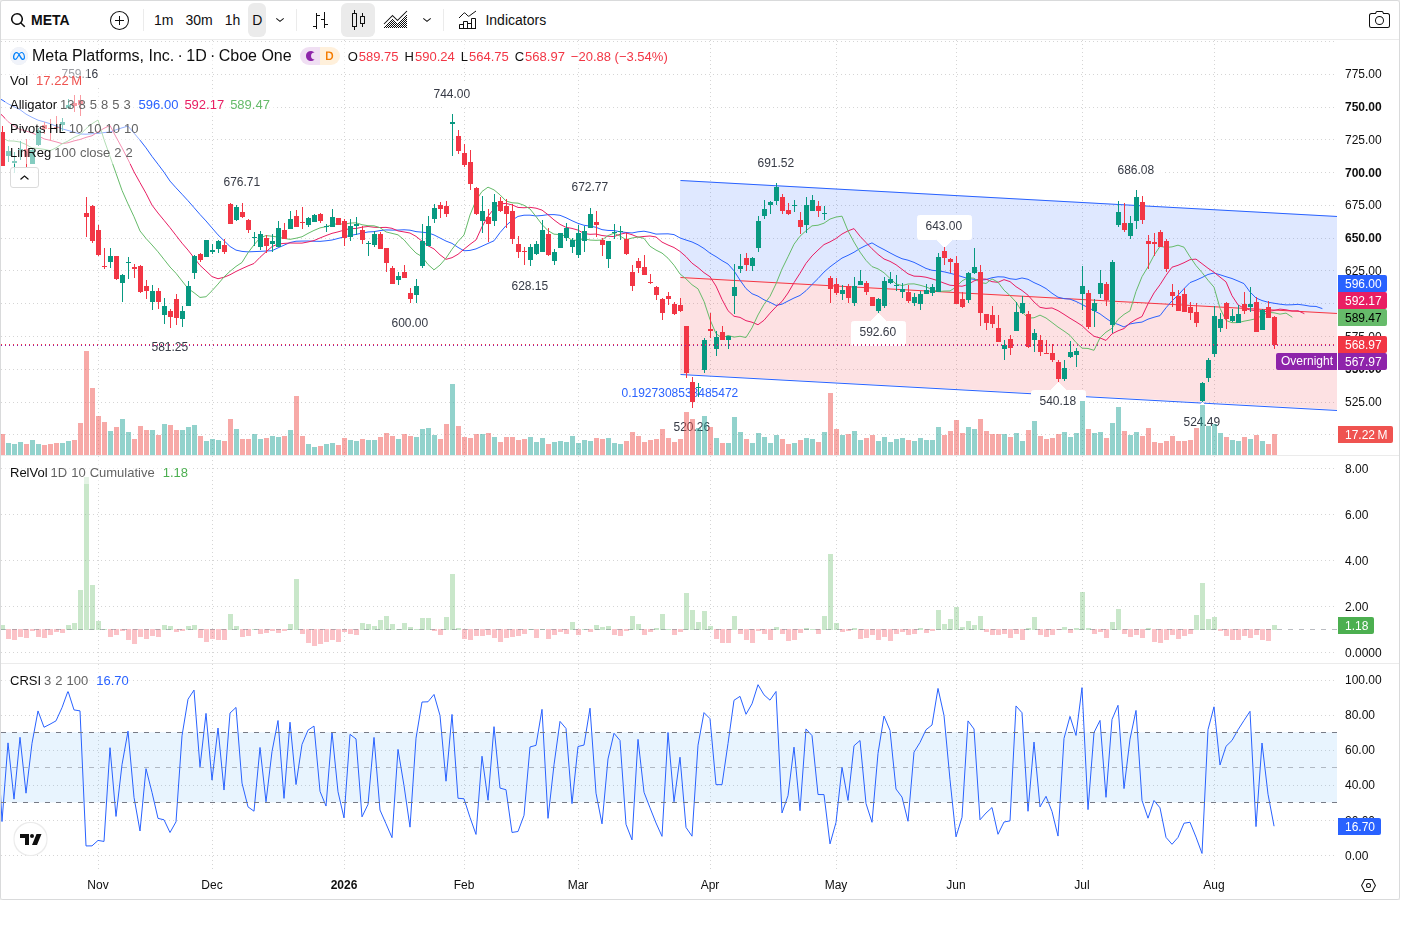
Meta is trading at 568.97 after a 3.54% drop from yesterday’s close; the prediction model sees early weakness into the 564–558 support band (intraday low 564.75 / VAL cluster) as the most likely path next session, but conflicting buyer-heavy flow and option strikes leave conviction low.
Technical picture — short bias, clear S/R bands
All supplied timeframes show a short-biased structure (Daily/60m/5m flagged SHORT or LH_LL) and price sits below corrective resistance. The Prediction Agent identifies primary support as the 558.0–568.0 zone (intraday low 564.75 plus Volume Profile VAL/HVN cluster) and primary resistance at the POC area near 595.20 (zone 592.0–600.0), reinforced by nearby 597–603 option call concentration. Secondary support is 527.5 (60m/daily structural support). The forecasted next-session move is down about -1.22% to an expected close of 562.0, with an expected intraday low of 555.0 and high of 582.0.
Volume and order-flow — participation but mixed signals
Intraday relative volume is elevated (RVOL ~1.14) and yesterday’s trading printed 15,997,529 shares versus lower multi-day averages. VFI is rising but remains below zero and MFI sits bullish (~62.85), indicating underlying buyer participation even as price fell. Directional large-order data shows an 85.92% buy share with a buy-sell imbalance of 1,250,980 (71.84% imbalance_pct), a divergence that reduces confidence in a pure short trade and raises the probability of range or mean-reversion paths despite the technical short structure.
Options and volatility — call OI forms a cap, puts give a defensive floor
Options flow shows heavy short-dated call volume and open interest concentrated around the 600 strike (largest call OI strike 600.0; important strike distance 5.454%). Significant put OI clusters sit in the 550 area (largest_put_oi_strike 550.0 and important strike 550.0 distance 3.334%). The POC resistance near 595.20 aligns with the 597–603 call-heavy zone, creating a likely seller defense; put-side positioning around the 550s aligns with secondary support. IV is ~37.26% vs. realized vol higher (~46.53%), indicating elevated realized volatility while IV sits below HV.
News & macro context — mixed-to-mildly bearish, event risk elevated
Company fundamentals remain mixed after the July 29 Q2 EPS miss and higher 2026 capex guidance; the news packet labels near-term bias as mild_bearish. Macro drivers (U.S. Treasury auctions this week and ongoing Fed-speak) are the stated medium event risk that could push yields higher and pressure growth names like Meta. The Prediction Agent assigns a medium event risk level and a prediction confidence of 65 with probabilities: bearish 55%, range 30%, bullish 15%.
Trade stance — no trade recommended
The session trade plan presents three scenarios (bullish reclaim above 595.20, range between 558–600, or bearish break below 558 to 527.5), but the model’s trade_idea is NO_TRADE with LOW conviction. The principal reason: structural short bias is partially offset by buyer-dominant intraday flow and conflicting options positioning, leaving no clean edge for a directional entry.
Outlook
Most likely path: early weakness into the 564–558 support band (test of 564.75/VAL area), a brief failed recovery toward 574–582, then renewed pressure that may revisit the 558 level before any late partial recovery. Bearish confirmation would be a 60m close below 558.0 on rising selling volume; bullish invalidation would be a sustained reclaim and hold above 595.20 with expanding volume and a 60m close above the 592–600 resistance zone. Given the conflicting volume and options signals, the model favors a mildly bearish or range-biased session but recommends waiting for a clear confirmation before taking a directional trade.
This article was generated by automated AI agents synthesizing technical, volume/flow, options, and news data — no human analyst reviewed it before publication.
It is provided for informational and educational purposes only and does not constitute investment, financial, trading, or legal advice, nor a recommendation or solicitation to buy or sell any security. This article may discuss both a near-term (next trading session) outlook and a separate longer-horizon (multi-month) scenario; the longer-horizon discussion is a deliberately broad, illustrative range of possible outcomes based on currently available information, not a price target or forecast, and is inherently more uncertain the further into the future it looks. AI-generated analysis may be incomplete, outdated, or inaccurate, and any forecasts, levels, or trade ideas described are not guaranteed and may not occur. Past patterns do not predict future results. Trading and investing involve substantial risk, including the risk of loss of principal. Always conduct your own research and consult a licensed financial advisor before making any investment decision. This platform and its operators assume no liability for actions taken based on this content.
Reference price at generation: $568.97.