NVDA sits on 224.50 micro-support; model flags mild bullish bounce toward 227.5–230 but recommends no new trade
Intraday structure is constructive but reversal is unconfirmed, volume participation is light and near‑term macro event risk is high—the model favors range/bounce action between 224.50 and 227.92 for the next session.
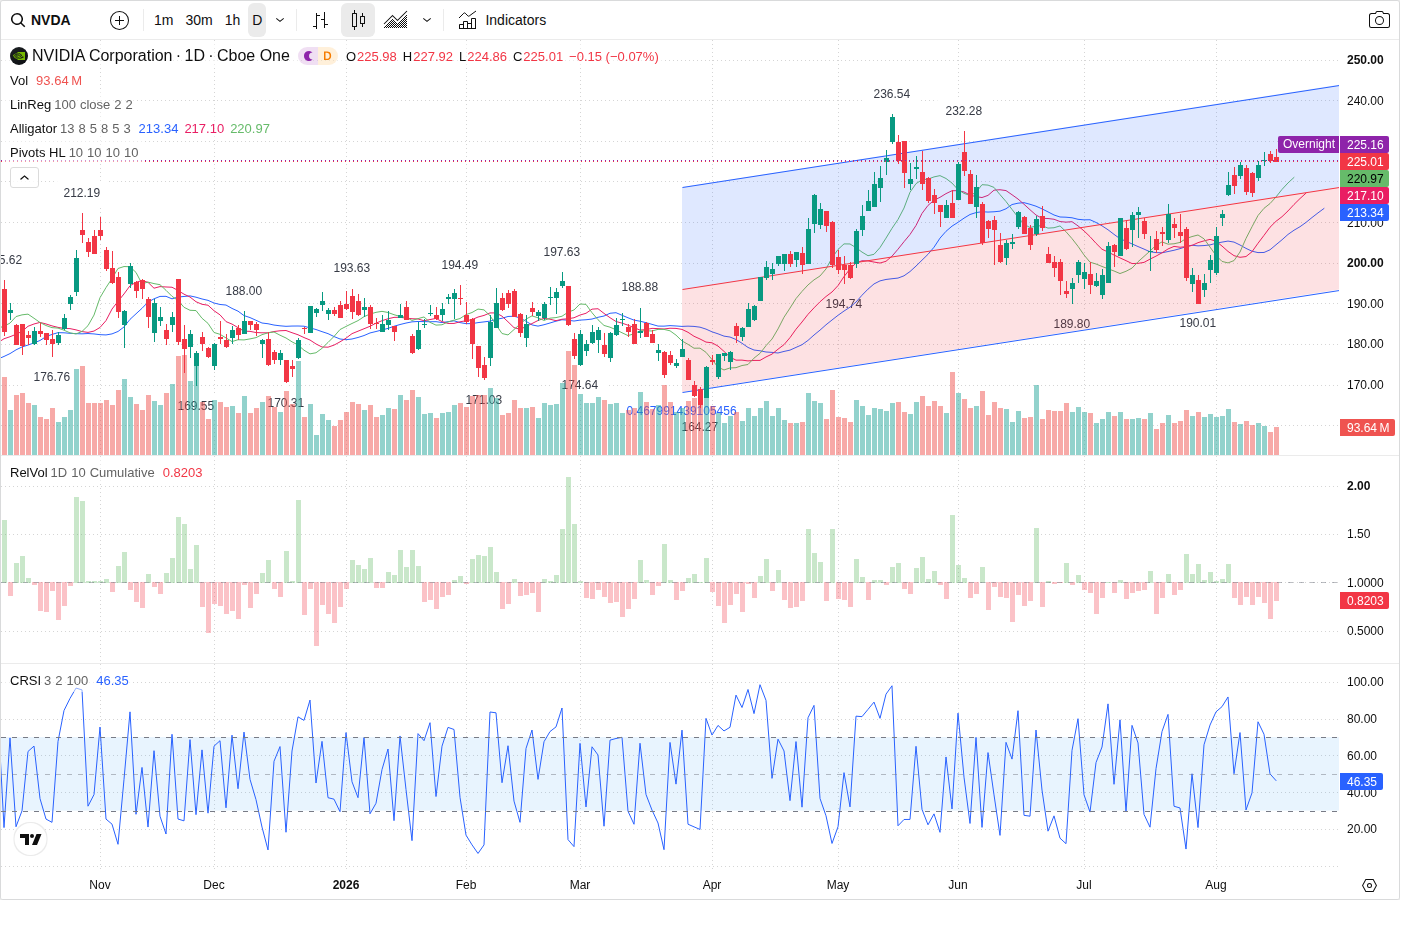
NVIDIA (NVDA) is trading near 225.01 in premarket, positioned at a short-term support band centered on 224.50; the prediction model expects a modest upside bias into the 227.5–230.0 area next session but advises waiting for confirmation before committing capital.
Technical picture — multi‑timeframe bias is bullish but reversal not confirmed
Across timeframes the dominant orientation is LONG: daily and 60‑minute charts retain higher-high / higher-low structure and a correction is active. On the 5‑minute the model registers HH/HL structure with price sitting at corrective support and an invalidation at 224.50. Primary short‑term support is the 224.50 zone (224.50–225.00) and nearest resistance is the recent intraday highs around 227.49–227.92; the model’s expected close for the session is 227.00 with an anticipated intraday high up to 230.00. Crucially, the intraday reversal has not yet been confirmed, so the bullish bias is a tactical bounce within a correction rather than a fresh trend breakout.
Volume and money flow — participation is light and flow slightly favoring sellers
Volume readings show a subdued regime: RVOL ≈ 0.72 (below recent averages) and current on‑exchange volume is smaller than 5‑ and 20‑day norms. VFI is positive and rising and MFI is bullish at 78.54—both indicate internal buying pressure—but directional prints show a small sell imbalance (buy_volume 1,348,383 vs sell_volume 1,449,644; imbalance -101,261, -3.62%) and capital flow sampling shows net large‑cap outflow (~ -22,748,954). The mixed picture—rising VFI/MFI alongside lighter participation and net outflows—reduces conviction for a clean, high‑probability breakout.
Options positioning — call concentration caps upside near 228.85–231.15
Options activity is skewed to calls: put/call volume and OI ratios ≈ 0.39 and 0.36 respectively, with heavy near‑term activity at the 225 ATM and the largest call OI at 230.00. The Prediction Agent highlights a major call positioning zone at 228.85–231.15 that will likely act as an upside node/resistance if momentum resumes. That call cluster aligns with the model’s secondary resistance (230.00) and supports the scenario where a reclaim above 227.50 would run into concentrated call OI.
News and macro — company fundamentals supportive but event risk is elevated
Fundamentals remain a tailwind: recent Q2 results and a large forward revenue guide (~$54B) support a medium‑term bullish bias. However, the macro calendar is the source of near‑term risk—Fed minutes and inflation prints mid‑week are flagged as HIGH event risk in the packet. The Prediction Agent summarizes this as a mild bullish next‑session bias tempered by potential volatility from yields and macro surprises, making opportunistic, small‑size range trading preferable to initiating full‑size directional positions now.
Outlook
The most likely path is a probe down to test 224.50 early in the session; if that zone holds, expect a gradual recovery toward 227.5–228.0 and a potential test of the call cluster at 228.85–231.15 (45% probability). Bullish confirmation requires a sustained reclaim above 227.50 on rising volume; bearish confirmation would be a sustained break and hold below 224.50 on 15m with expanding selling, opening a move to secondary support at 216.18. The model’s trade_idea is NO_TRADE with LOW conviction—wait for reversal confirmation or stronger participation before taking a directional position.
This article was generated by automated AI agents synthesizing technical, volume/flow, options, and news data — no human analyst reviewed it before publication.
It is provided for informational and educational purposes only and does not constitute investment, financial, trading, or legal advice, nor a recommendation or solicitation to buy or sell any security. This article may discuss both a near-term (next trading session) outlook and a separate longer-horizon (multi-month) scenario; the longer-horizon discussion is a deliberately broad, illustrative range of possible outcomes based on currently available information, not a price target or forecast, and is inherently more uncertain the further into the future it looks. AI-generated analysis may be incomplete, outdated, or inaccurate, and any forecasts, levels, or trade ideas described are not guaranteed and may not occur. Past patterns do not predict future results. Trading and investing involve substantial risk, including the risk of loss of principal. Always conduct your own research and consult a licensed financial advisor before making any investment decision. This platform and its operators assume no liability for actions taken based on this content.
Reference price at generation: $225.01.