AAPL likely to test $300 support as intraday correction remains active; no high‑confidence trade identified
Model sees a mild bearish session with probes toward the $300 60‑min swing low / put‑OI cluster and resistance congestion around the $308.45–311.55 call‑OI/POC zone.
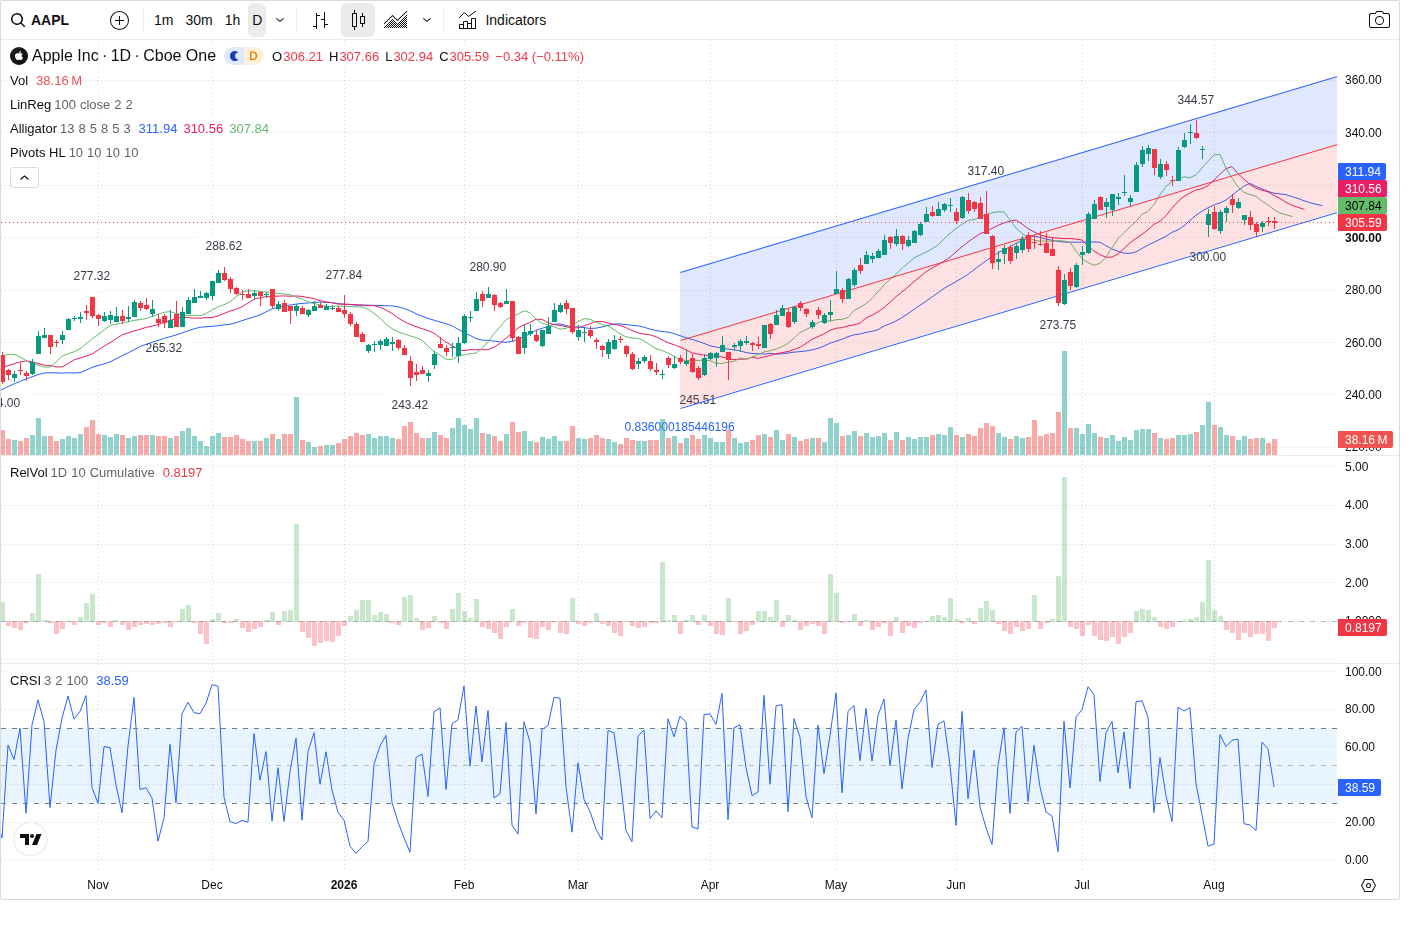
Apple (AAPL) is trading near $305.59 premarket as the prediction model flags a short‑term corrective bias and expects early probes toward primary support at $300.00 next session; the call‑ and put‑option concentrations above and below price create a two‑way battleground and the model recommends no new trade entry due to low conviction.
Technical picture — mixed timeframes, short‑term bearish tilt
The Forecast labels the next session MILD_BEARISH (60% confidence) with a short‑term corrective bias. Intraday (5m) structure is mixed but sitting 'through_corrective_resistance' with the nearest resistance at 307.66 and support at 300.57; correction is active. The 60‑minute chart retains a longer intraday LONG structure (HH/HL) but shows a corrective short trend and is 'approaching_entry_zone' with a clear 60m swing low at 300.00 (invalidation price). Daily remains in a longer‑term up channel but is also in a corrective phase. The model's most likely path: open flat, early probes toward $300.00, then choppy recovery into the $306–310 POC/call‑OI zone if $300 holds.
Volume and capital‑flow confirmation — sellers dominate, volume light
Volume is below recent averages (RVOL ~0.65) and trending down; intraday directional flow heavily favors sellers (sell_pct 90.52%, net volume -5,627,177). VFI remains above zero but is falling and MFI sits neutral at ~42.65. Capital‑flow sampling shows large‑order net outflow (net ≈ -1.7196B dominated by large trades). The prediction notes volume does not support a bullish breakout and instead backs a mild bearish/corrective outcome — which is why the trade idea is NO_TRADE: there is insufficient expanding volume or flow to trust a directional entry.
Options landscape — pinned battleground at 300 and 310
Options positioning creates defined near‑term levels. The largest call OI and volume cluster sits at the 310 strike and the volume‑profile POC is 310.63536458333334, making the 308.45–311.55 zone the primary resistance area. Conversely, the 300 strike holds large put OI and forms the primary support zone defined as $299.00–$301.00. The model highlights these exact option zones as the session's likely supply/demand anchors: a clean reclaim above 311.55 on rising volume would confirm a bullish branch; a break and close below 300.00 with rising sell volume would confirm bearish continuation.
News & macro drivers — constructive company backdrop but medium event risk
Company news remains constructive (strong July quarter and Services resilience) and the multi‑day bias is MILD_BULLISH, but macro forces are a headwind: rising Treasury yields, oil moves and this week’s releases (July FOMC minutes Aug 19, CPI/PPI prints) create MEDIUM event risk. The Prediction Agent flags that short‑term moves are more likely to be driven by macro surprises than fresh company developments, keeping next‑session bias neutral to mildly bearish.
Outlook
Most likely outcome for the next session is a mild bearish/correction day with intraday range roughly $300.5–$310.5 and an expected close near $304.50. Key confirmations to watch: bearish confirmation is a clean break and close below $300.00 on rising sell‑initiated volume and worsening flow metrics; bullish confirmation is a sustained reclaim and close above $311.55 on expanding volume and positive large‑order flow. Because reversal is unconfirmed, volume is below average and order flow strongly favors sellers, the model rates conviction LOW and recommends NO_TRADE until one of those confirmations occurs.
This article was generated by automated AI agents synthesizing technical, volume/flow, options, and news data — no human analyst reviewed it before publication.
It is provided for informational and educational purposes only and does not constitute investment, financial, trading, or legal advice, nor a recommendation or solicitation to buy or sell any security. This article may discuss both a near-term (next trading session) outlook and a separate longer-horizon (multi-month) scenario; the longer-horizon discussion is a deliberately broad, illustrative range of possible outcomes based on currently available information, not a price target or forecast, and is inherently more uncertain the further into the future it looks. AI-generated analysis may be incomplete, outdated, or inaccurate, and any forecasts, levels, or trade ideas described are not guaranteed and may not occur. Past patterns do not predict future results. Trading and investing involve substantial risk, including the risk of loss of principal. Always conduct your own research and consult a licensed financial advisor before making any investment decision. This platform and its operators assume no liability for actions taken based on this content.
Reference price at generation: $305.59.