QQQ seen drifting toward POC support ~717.64 into Fed-minute/earnings week; reversal remains unconfirmed
Prediction model favors a mild bearish session with an expected intraday low near 716 and no new directional trade until a clear breakout or breakdown confirms.
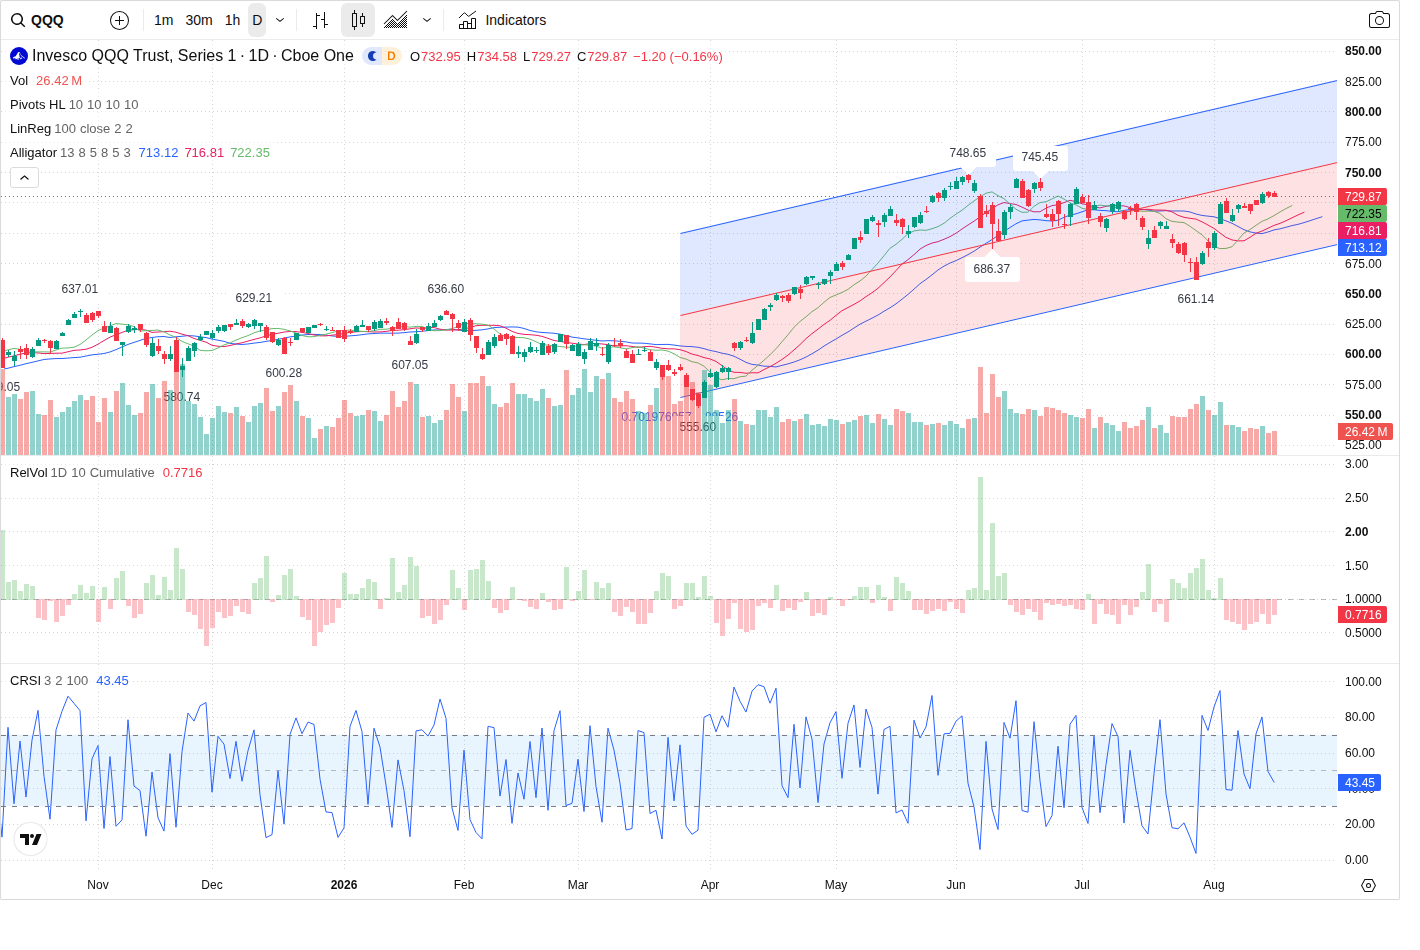
QQQ (current 729.87) is positioned inside a corrective phase despite longer-term bullish trend context; the model expects mild selling pressure into the high‑volume Point‑of‑Control near 717.6439583333333 next session, but it recommends no fresh directional trade until a reclaim above 734.58 or a decisive break below 716.00.
Technical picture — short correction inside longer bullish trend
Across timeframes the dominant backdrop remains long on 60m and daily, but a corrective short-term trend is active. The 5m shows a HH/HL intraday structure (long bias) while currently “waiting_for_reversal.” Primary support is the volume POC at 717.6439583333333 (zone 716.0–720.0) and the nearest resistance is the recent 5m swing high at 734.58 (zone 732.0–736.5). The model’s expected close for the next session is 724.4 with an anticipated intraday low of 716.0 and high around 736.0—a trading band consistent with the correction and the intraday consolidation visible on the 5m and 60m charts.
Volume and order flow — muted participation, but positive money flow
Session volume is below recent averages (RVOL ~0.71) and total session involvement is muted, reducing conviction for any breakout. That said, internal indicators show buyer participation: VFI is rising and above zero, MFI is bullish around 73.36, and directional prints show a buy imbalance (buy_pct 64.94) with a net buy imbalance of 328,957. These mixed signs (low overall volume but positive money‑flow metrics) support the forecast of a mild bearish drift into a high‑volume support area that buyers will likely attempt to defend rather than a clean, high‑conviction breakdown.
Options and volatility — near‑term put demand skews downside
Short‑dated options show elevated put volume (put/call volume ~1.269) and concentrated put open interest at strikes in the 680–700 band for near expiries; notable activity also appears at 720 and 730 strikes. IV sits at 0.1623 while historical volatility is higher (HV 0.2368), producing an IV/HV spread of -0.0745. The options flow slightly favors downside hedging around current levels but does not override the technical S/R picture. In practice this means options positioning could increase pressure if price probes the 717.64 POC, but it is not a standalone trigger for a directional trade.
News & macro — event risk elevates uncertainty
News flow is mixed with a next‑session bias assessed as mild bearish. The packet highlights high event risk from Fed (July) meeting minutes mid‑week and clustered marquee tech earnings (NVIDIA highest impact), alongside a backdrop of rising Treasury yields and higher oil. Those macro items create binary outcomes that can quickly widen intraday ranges; the Prediction Agent assigns event_risk = HIGH and reduces conviction for initiating new positions ahead of the outcomes.
Session trade plan — wait for confirmation
The model issues NO_TRADE for the next session (conviction LOW). It recommends waiting for either: 1) bullish confirmation — sustained break and hold above 734.58 on expanding volume/VFI (target secondary resistance 748.63), or 2) bearish confirmation — break and close below 716.00 with rising selling volume and negative large‑order flow (target secondary support 704.885). If neither threshold is taken, expect range chop between 716.0–736.0 and consider tactical, tight‑stop range trades only around the primary S/R zones.
Outlook
Most likely path is a mild bearish drift into the volume‑POC around 717.6439583333333 where buyers are likely to defend (expected intraday low ~716.0). Confirmation of either a bullish reclaim above 734.58 or a bearish close below 716.00 — accompanied by expanding volume/VFI movement — is required to validate a directional trade. Elevated event risk this week keeps conviction subdued; traders should watch Fed minutes and large‑cap earnings as the primary catalysts that could force a wider move.
This article was generated by automated AI agents synthesizing technical, volume/flow, options, and news data — no human analyst reviewed it before publication.
It is provided for informational and educational purposes only and does not constitute investment, financial, trading, or legal advice, nor a recommendation or solicitation to buy or sell any security. This article may discuss both a near-term (next trading session) outlook and a separate longer-horizon (multi-month) scenario; the longer-horizon discussion is a deliberately broad, illustrative range of possible outcomes based on currently available information, not a price target or forecast, and is inherently more uncertain the further into the future it looks. AI-generated analysis may be incomplete, outdated, or inaccurate, and any forecasts, levels, or trade ideas described are not guaranteed and may not occur. Past patterns do not predict future results. Trading and investing involve substantial risk, including the risk of loss of principal. Always conduct your own research and consult a licensed financial advisor before making any investment decision. This platform and its operators assume no liability for actions taken based on this content.
Reference price at generation: $729.87.