TSLA near short-term support 335.33; model expects mild bullish test of 348–352 but flags NO_TRADE until reversal confirms
5‑minute structure is bullish but 60m/daily remain corrective; the model prefers waiting for a clear breakout above 352 or a breakdown below 335.33 before taking a directional position.
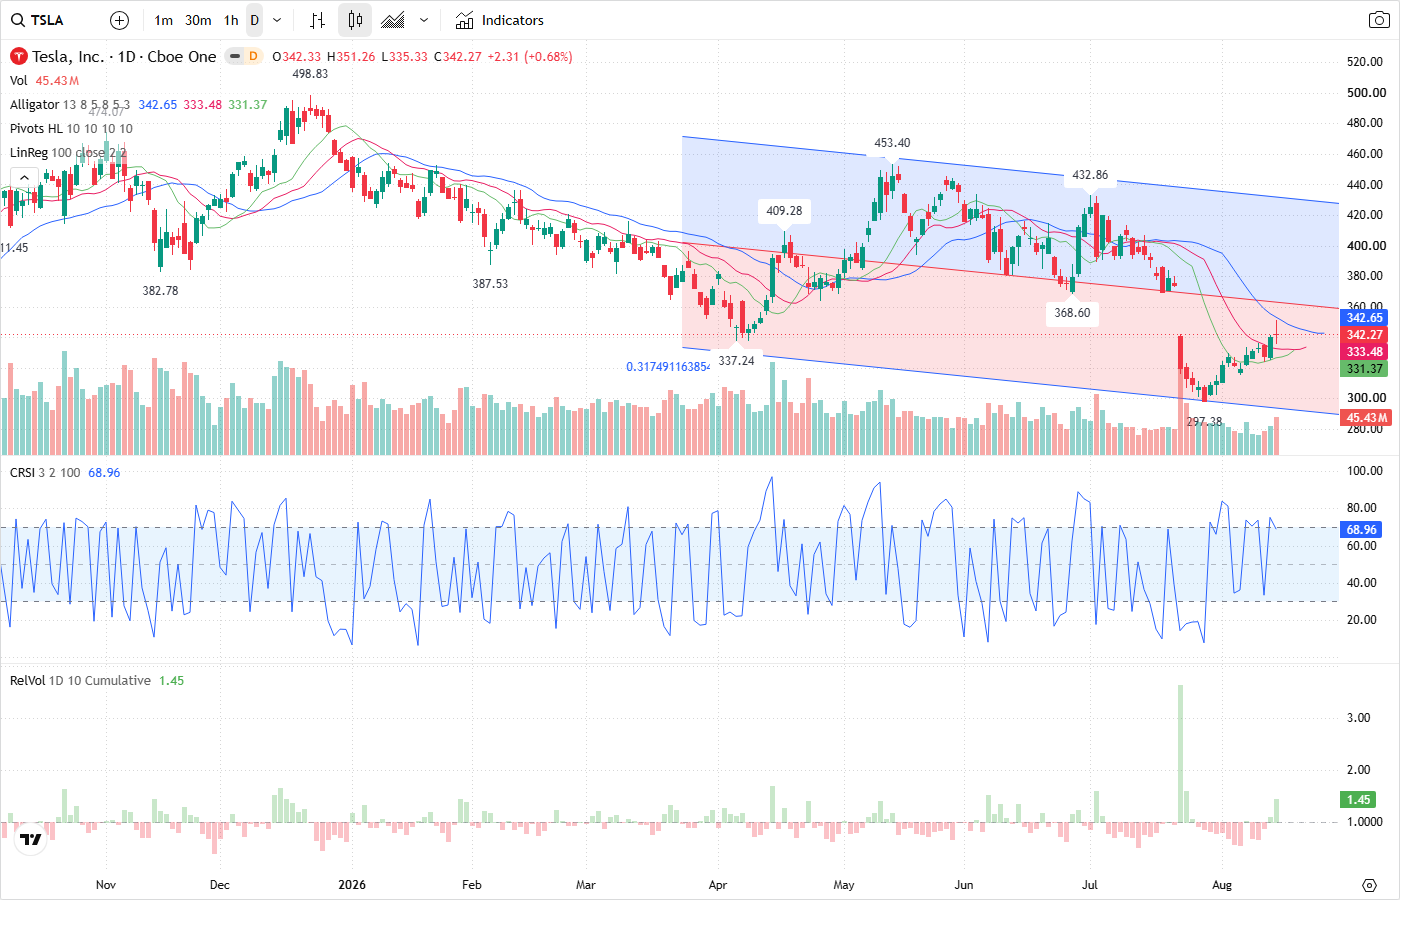
Tesla (TSLA) closed the session at 342.27, sitting just above a clustered support zone around 335.33–337.50. The prediction model sees a mild bullish path for the next regular session — a bounce from the 335.33 area toward the 348–352 resistance band (350 options concentration) — but recommends no new directional trade until a reversal is confirmed.
Technical picture — multi‑timeframe nuance
On the 5‑minute timeframe TSLA shows a clear HH/HL structure (trend: LONG) with price located at corrective support; the immediate invalidation for the short intraday bullish case is the 5m reaction low at 335.3306. The 60‑minute and daily charts tell a different story: both timeframes remain corrective to the downside (60m structure LH/LL; daily trend SHORT) with price below daily corrective resistance. That divergence is why the setup is classed as a BULLISH_PULLBACK_REVERSAL but still “waiting_for_reversal.”
Support, resistance and the likely path
The model’s primary support zone is 335.3306–337.50 (5m low plus a nearby daily swing low at 337.24); primary resistance is the 348–352 band with 350 singled out by options positioning and the intraday high (5m swing high 351.26). The most likely path: early session test of 335.33–337.50 that holds, improving buying pressure, then a push toward 348–352. Expected intraday range is 335.3306 to 351.26, with an expected close near 346.99 (expected change +1.37%). A decisive sustained breakout and close above 352 would confirm the bullish reversal; a break and daily/60m close below 335.3306 would confirm the bearish continuation.
Volume, flow and participation — mixed confirmation
Volume readings are mixed. RVOL is elevated at 1.1942650191975184 (current volume 43,421,235 vs recent averages), but the packet notes a decreasing volume trend overall. VFI is rising (current -0.7974, improving from -1.3049) and MFI is bullish and rising at 66.9163 — both supportive of improving buying pressure. Offsetting that, directional tick shows a small net sell imbalance (imbalance -15,169; dominant_side: SELLERS) and capital flow registers net outflows driven by large orders (large net -6,662,223.75). The model therefore sees partial confirmation but also conflict between improving short‑term internal indicators and larger‑order outflows.
Options positioning amplifies the 350 resistance
Options activity is call‑weighted near term (total_call_volume 148,665 vs total_put_volume 67,689; volume put/call ~0.4553). Important strikes cluster around 340/345/350 for calls, with the largest call OI at 350. The model highlights a major call OI concentration in a 348.25–351.75 zone as reinforcing resistance and a put‑OI cluster around 318.4–321.6 as a lower positioning band. That concentration makes 350 a logical target/obstacle if buyers re‑assert control.
Trade idea and risk
The session trade plan lays out three paths — bullish (hold 335.33–337.50 then test 348–352), range (chop between those bands), and bearish (break below 335.33 toward 325.17125). However, trade_idea.direction is NO_TRADE with LOW conviction. Rationale: the short 5m pullback looks constructive but reversal is not confirmed and 60m/daily higher‑timeframe trends remain corrective; mixed volume/capital‑flow readings further reduce conviction. Event risk is LOW. The packet’s explicit confirmations are: bullish confirmation = sustained intraday breakout and close above 352 on above‑average volume (RVOL > 1) and improving VFI/MFI; bearish confirmation = break and close below 335.3306 with expanding selling volume and worsening VFI.
Outlook
Most likely next session is a mild bullish attempt: a hold of 335.33–337.50 supports a push to 348–352 where the 350 call OI concentration will likely cap or test buyers. The setup remains untradeable per the model until either a sustained close above 352 (bullish confirmation) or a decisive breakdown and close below 335.3306 (bearish confirmation). Absent those confirmations, expect intraday chop and consider range tactics rather than a fresh directional entry.
This article was generated by automated AI agents synthesizing technical, volume/flow, options, and news data — no human analyst reviewed it before publication.
It is provided for informational and educational purposes only and does not constitute investment, financial, trading, or legal advice, nor a recommendation or solicitation to buy or sell any security. This article may discuss both a near-term (next trading session) outlook and a separate longer-horizon (multi-month) scenario; the longer-horizon discussion is a deliberately broad, illustrative range of possible outcomes based on currently available information, not a price target or forecast, and is inherently more uncertain the further into the future it looks. AI-generated analysis may be incomplete, outdated, or inaccurate, and any forecasts, levels, or trade ideas described are not guaranteed and may not occur. Past patterns do not predict future results. Trading and investing involve substantial risk, including the risk of loss of principal. Always conduct your own research and consult a licensed financial advisor before making any investment decision. This platform and its operators assume no liability for actions taken based on this content.
Reference price at generation: $342.27.