META sitting on 578.25 support ahead of POC at 601.93; model flags no trade until confirmation
Prediction model sees a mild bullish tilt for the next session but declines to recommend a directional trade until either a clean reclaim above 603 on volume or a defended bounce from 575–582.
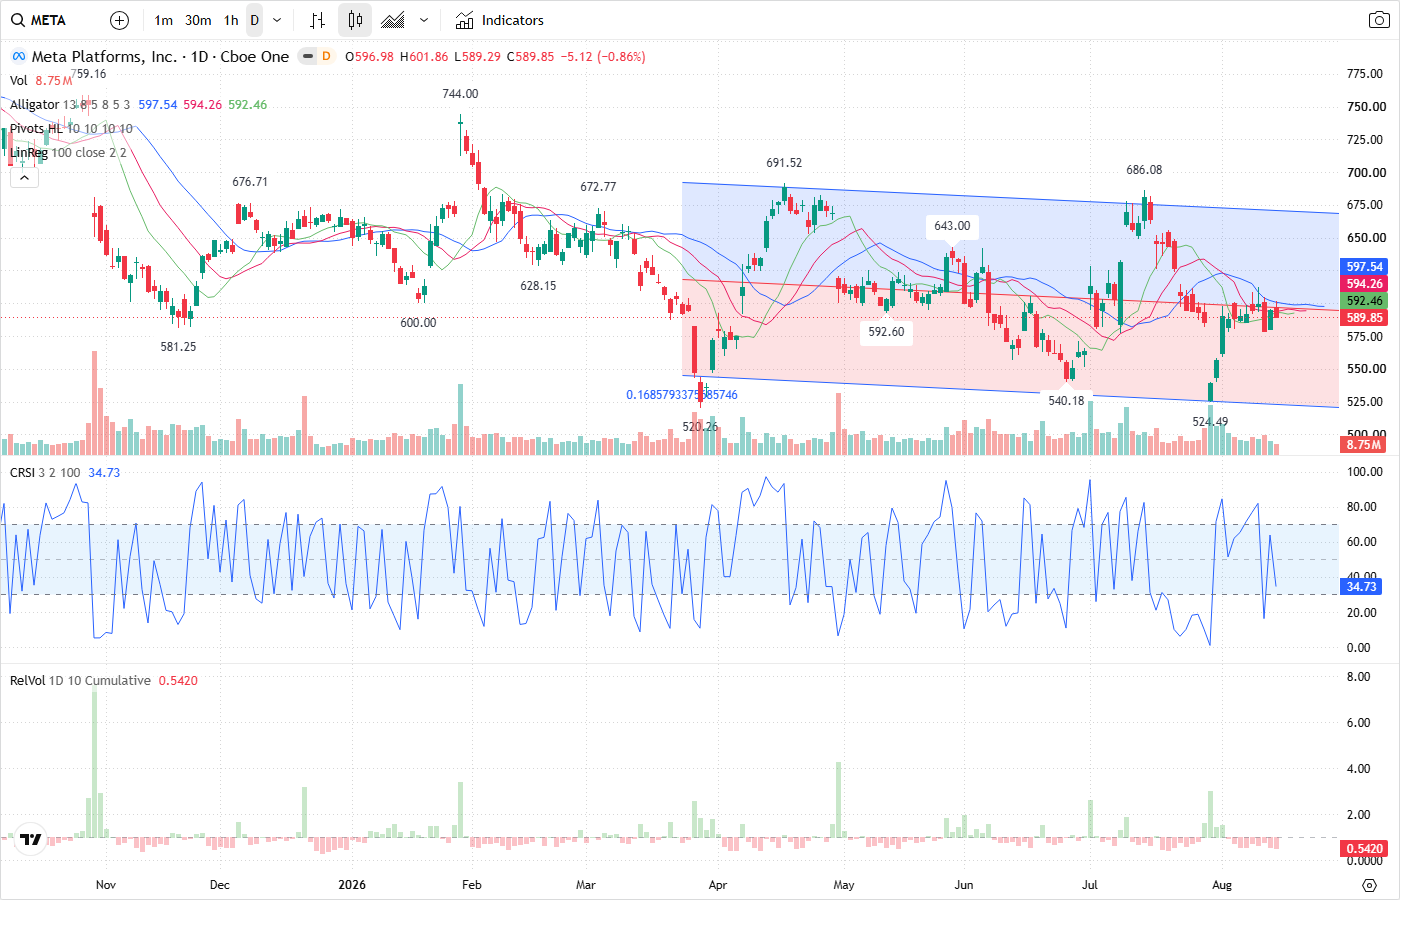
Meta (META) closed the session at 589.85, trading inside a corrective pullback with short-term buyers likely to defend the 578.25 area and sellers clustered around the volume-profile point of control at 601.93. The model’s next-session outlook is mildly bullish (55% confidence) but issues a NO_TRADE call pending confirmation from price and participation.
Technical picture — mixed multi-timeframe structure
The multi-timeframe read is mixed: the 5-minute shows a LONG trend inside a corrective SHORT (LH_LL intraday structure) with the immediate corrective low at 578.25 and corrective resistance near the 601.86–603 area. The 60-minute and daily timeframes retain a SHORT bias with LH/LL structure and price located below corrective resistance. The Prediction Agent identifies primary near-term support at 578.25 (support zone 575.00–582.00) and primary resistance at the volume-profile POC 601.93 (zone 600.00–603.00). Secondary levels are VAL/secondary support 564.91 and secondary resistance 620.00.
Volume and capital flow — participation is weak
Participation does not yet confirm a high-probability reversal. Relative volume is low (RVOL 0.5339) and yesterday’s print was about 34.5% below the 5-day average and 46.6% below the 20-day average. VFI has risen from deeper negative readings (current -10.243, rising) and MFI is bullish and climbing (current 64.2779), but directional intraday order flow favored sellers (net imbalance -38,020; sellers 61.34%). Capital-flow sampling shows net outflows across the panel (large-order net -21,442,372.71; total net -22,441,994.02), weighing against a confident bullish claim despite the short-term support.
Options & volume-profile — clear S/R, concentrated positioning
Options positioning and the volume profile provide the cleanest S/R map. The volume-profile point of control sits at 601.9336458333333 and aligns with large call open interest concentrated at the 600 strike (largest call OI strike 600.0). On the downside, notable put OI clusters sit between roughly 547.25–552.75 and concentrated put volume/oi around the 580 and 550 strikes, reinforcing the 575–582 support band. The options picture therefore strengthens the POC as a seller-defended ceiling and the 578–580 area as the likeliest near-term buyer defense.
Session trade plan — scenarios and confirmations
The Model’s session plan lays out three paths: bullish — hold/reclaim 575.00–582.00 with rising buying volume to test 600.00–603.00 and then 620.00 if 603.00 is taken; range — consolidation between 575.00–582.00 and 600.00–603.00 if neither side asserts control; bearish — a break/hold below 575.00 that targets 564.91 and then the larger put OI zone 547.25–552.75. Bullish confirmation is defined as sustained intraday trade above 603.00 together with rising RVOL (>1.0) and reclaim of the POC zone; bearish confirmation is a sustained close below 575.00 on expanding sell volume and negative large-order flow. The model’s expected intraday range is a low near 582.00 and a high near 603.00 with an expected close around 593.00 (expected change +0.53%).
Outlook
Most likely next-session path is a mild rebound attempt if 578.25 (575.00–582.00) holds, with upside capped by the POC around 601.93. Low participation (RVOL ~0.54) and net large-order outflows keep conviction low (prediction confidence 55%); the model therefore issues NO_TRADE until either a confirmed reclaim above 603.00 on expanding volume or a clearly defended bounce off 575.00–582.00 appears.
This article was generated by automated AI agents synthesizing technical, volume/flow, options, and news data — no human analyst reviewed it before publication.
It is provided for informational and educational purposes only and does not constitute investment, financial, trading, or legal advice, nor a recommendation or solicitation to buy or sell any security. This article may discuss both a near-term (next trading session) outlook and a separate longer-horizon (multi-month) scenario; the longer-horizon discussion is a deliberately broad, illustrative range of possible outcomes based on currently available information, not a price target or forecast, and is inherently more uncertain the further into the future it looks. AI-generated analysis may be incomplete, outdated, or inaccurate, and any forecasts, levels, or trade ideas described are not guaranteed and may not occur. Past patterns do not predict future results. Trading and investing involve substantial risk, including the risk of loss of principal. Always conduct your own research and consult a licensed financial advisor before making any investment decision. This platform and its operators assume no liability for actions taken based on this content.
Reference price at generation: $589.85.