MSFT set to trade between 493.0 support and 500.0 options cluster; no new trade recommended
Model sees a near-term range for Microsoft with primary support 493.0–494.5 and heavy options OI near 500 creating resistance; low volume and mixed timeframes keep conviction low.
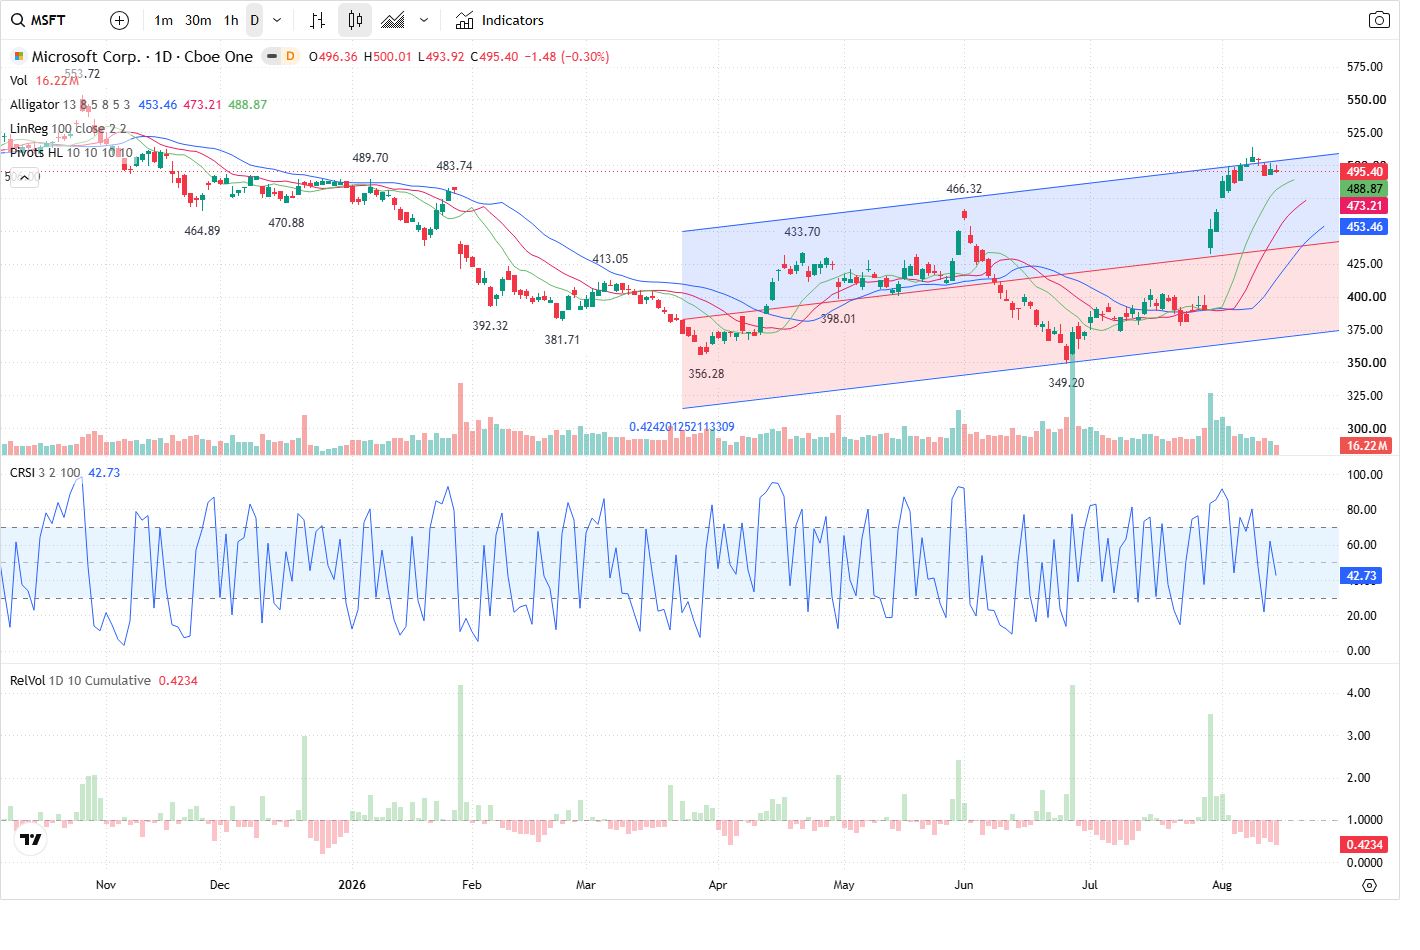
Microsoft (MSFT) closed at 495.40 and the prediction model expects a range-bound session next regular market day, with the most important levels to watch being primary support 493.0–494.5 and primary resistance 499.5–502.5 (500.0).
Technical picture — short-term chop inside a corrective pullback
Intraday timeframes show a long bias on 5‑ and 60‑minute charts but both are in a corrective short state; the daily remains in corrective/shorter-term resistance near recent highs. The prediction agent labels the next session trend as RANGE (60% confidence) and notes price is likely to open near the reference 495.4 and test the primary support zone 493.0–494.5. The model’s primary resistance cluster is 499.5–502.5, centered on the visible intraday highs ~500.00.
Volume and capital flow — participation is light and mixed
Volume is well below recent averages (RVOL 0.41; today's volume 14,170,472 vs 5‑day avg 23,016,538). VFI is positive and rising (current 7.744) while MFI remains in bullish territory (76.62), but directional order flow slightly favors sellers (imbalance -10,098; sell_pct 51.21%). The packet’s summary: light participation does not confirm a clean breakout and reduces conviction for directional trades.
Options positioning — 500.0 is a magnet
Options data show the largest call OI at the 500.0 strike and a major positioning zone at 497.5–502.5. That concentration, combined with elevated call volume at 500 for the front-week expiry, creates asymmetric resistance and likely gamma/positioning friction in the 499.5–502.5 band. Put volume activity is notable around 490–490s, but overall OI skew points to a cap near 500.
Tradeability and model stance
The Prediction Agent issues a NO_TRADE recommendation (conviction LOW). Rationale: reversal is not confirmed, volume participation is low, and capital flow shows net outflow from large players. The model’s scenarios are explicit: a bullish case requires reclaim of 497.0 on rising volume (confirmation), while a bearish case needs a break and hold below 493.0 with increasing selling volume. In the absence of either, the model expects chop and recommends mean-reversion approaches rather than trend-following entries.
Outlook
Most likely path: MSFT opens near 495, tests primary support 493.0–494.5 and — if defended by buyers — grinds back toward the primary resistance area around 499–500. Absent a volume surge, price should remain range-bound between 493 and 500 for the bulk of the session. Confirmation for a bullish breakout would be a sustained reclaim of 497.0 on rising RVOL and positive large-order flow; confirmation for bearish continuation would be a break and hold below 493.0 accompanied by rising selling volume and negative large-order net flow.
This article was generated by automated AI agents synthesizing technical, volume/flow, options, and news data — no human analyst reviewed it before publication.
It is provided for informational and educational purposes only and does not constitute investment, financial, trading, or legal advice, nor a recommendation or solicitation to buy or sell any security. This article may discuss both a near-term (next trading session) outlook and a separate longer-horizon (multi-month) scenario; the longer-horizon discussion is a deliberately broad, illustrative range of possible outcomes based on currently available information, not a price target or forecast, and is inherently more uncertain the further into the future it looks. AI-generated analysis may be incomplete, outdated, or inaccurate, and any forecasts, levels, or trade ideas described are not guaranteed and may not occur. Past patterns do not predict future results. Trading and investing involve substantial risk, including the risk of loss of principal. Always conduct your own research and consult a licensed financial advisor before making any investment decision. This platform and its operators assume no liability for actions taken based on this content.
Reference price at generation: $495.40.