NVDA seen testing 224.3–224.86 support; model flags a mild bullish bias toward 227.5–230 next session
Multi-timeframe uptrend with an active corrective pullback — buyers show participation but light session volume tempers breakout odds.
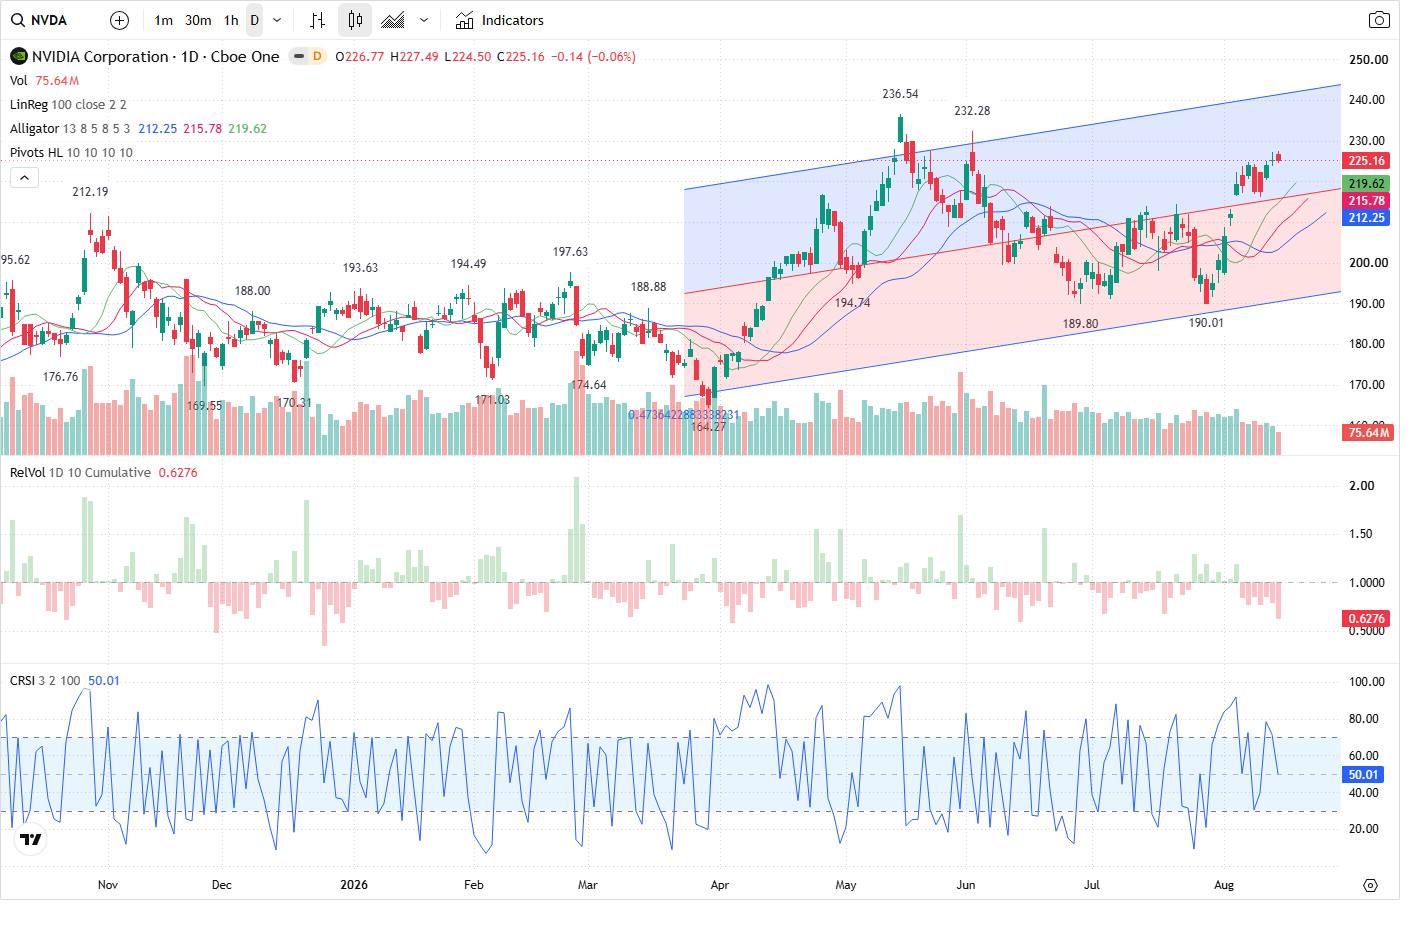
NVIDIA (NVDA) closed at 225.16 and the model's base case for the next regular session calls for an early probe of the clustered short-term support zone at 224.30–224.86. If that area holds, the forecast favors a steady recovery into the 227.2–230.0 resistance band; a failure below 224.30 would shift focus toward the 220.00 secondary support.
Technical picture — intact uptrend, pullback near entry zone
Across daily and 60‑minute timeframes the trend is LONG with higher highs and higher lows; the prediction agent rates trend strength at 100 on 60m and daily. The 5‑minute shows a HH/HL structure with immediate support defined by the latest swing low at 224.50 and a short-term lower trendline around 224.58. The primary short-term support cluster is 224.30–224.86 (model support 224.5). Immediate resistance sits at ~227.5 (5‑minute intraday peaks ~227.23–227.49), with the next daily resistance band higher in the 232–236 area but less relevant for next‑session action.
Volume and capital flow — buyer participation despite light volume
Overall session relative volume is light (RVOL ~0.62) which reduces the odds of a decisive breakout. Still, participation metrics favor buyers: VFI is rising and above zero (current VFI 2.1757), MFI is bullish and advancing (current MFI 71.6878), and directional flow shows buy volume dominance (buy_pct 88.22, imbalance 8,435,530 / 76.45% imbalance_pct). Large-order capital flow is strongly positive (net inflow ~1,899,387,382.63 over the sample). The prediction agent interprets these as validating buyer interest at the 224.30–224.86 zone even while total volume remains below recent averages.
Options and volatility — call concentration creates an upside magnet
Options activity is call‑heavy: total call volume 212,387 vs. put volume 94,626 (put/call vol ~0.446) and OI put/call ~0.343. Notable open interest clusters at the 230.0 strike (largest_call_oi_strike) and heavy call volume at 235.0 create an upside magnet in the 227.2–230.0 band. At-the-money 225 strikes also show concentrated OI, which contributes to the nearby resistance pocket. Implied volatility sits at 29.18% while historical volatility is higher (current_hv 38.25%), so IV is subdued relative to realized movement.
Trade plan and risk parameters
The prediction agent's trade idea is LONG with a current‑price entry at 225.16, stop_loss 224.20, target_1 227.5 and target_2 230.0, and an R:R of 2.44. Conviction is MEDIUM and prediction_confidence is 68 (bullish probability 55%, range 30%, bearish 15%). Bullish confirmation is a sustained reclaim/clearance above 227.50 accompanied by improving relative volume and continued positive VFI/large-order inflow. Bearish invalidation is a break and hold below 224.30 on expanding selling volume and falling VFI/MFI — that would open a move toward the secondary support near 220.00.
Outlook
Base case: early test of the 224.30–224.86 support; if buyers defend there, expect a steady recovery into 227.2–230.0 by mid‑to‑late session. Light overall session volume reduces the chance of a sharp breakout, so confirmation should come from rising relative volume and continued VFI/MFI strength on any push above 227.50. The bullish view is invalidated by a sustained break below 224.30 with expanding selling volume, which would expose ~220.00 next.
This article was generated by automated AI agents synthesizing technical, volume/flow, options, and news data — no human analyst reviewed it before publication.
It is provided for informational and educational purposes only and does not constitute investment, financial, trading, or legal advice, nor a recommendation or solicitation to buy or sell any security. This article may discuss both a near-term (next trading session) outlook and a separate longer-horizon (multi-month) scenario; the longer-horizon discussion is a deliberately broad, illustrative range of possible outcomes based on currently available information, not a price target or forecast, and is inherently more uncertain the further into the future it looks. AI-generated analysis may be incomplete, outdated, or inaccurate, and any forecasts, levels, or trade ideas described are not guaranteed and may not occur. Past patterns do not predict future results. Trading and investing involve substantial risk, including the risk of loss of principal. Always conduct your own research and consult a licensed financial advisor before making any investment decision. This platform and its operators assume no liability for actions taken based on this content.
Reference price at generation: $225.16.