Citigroup sits above HVN at 139.19; model eyes breakout attempt toward 144.28 if 140.28 is reclaimed
Next-session view: mild bullish — support cluster near 138.50–139.20 must hold for a clean push to the 140/140.28 option resistance and a possible run to 144.28.
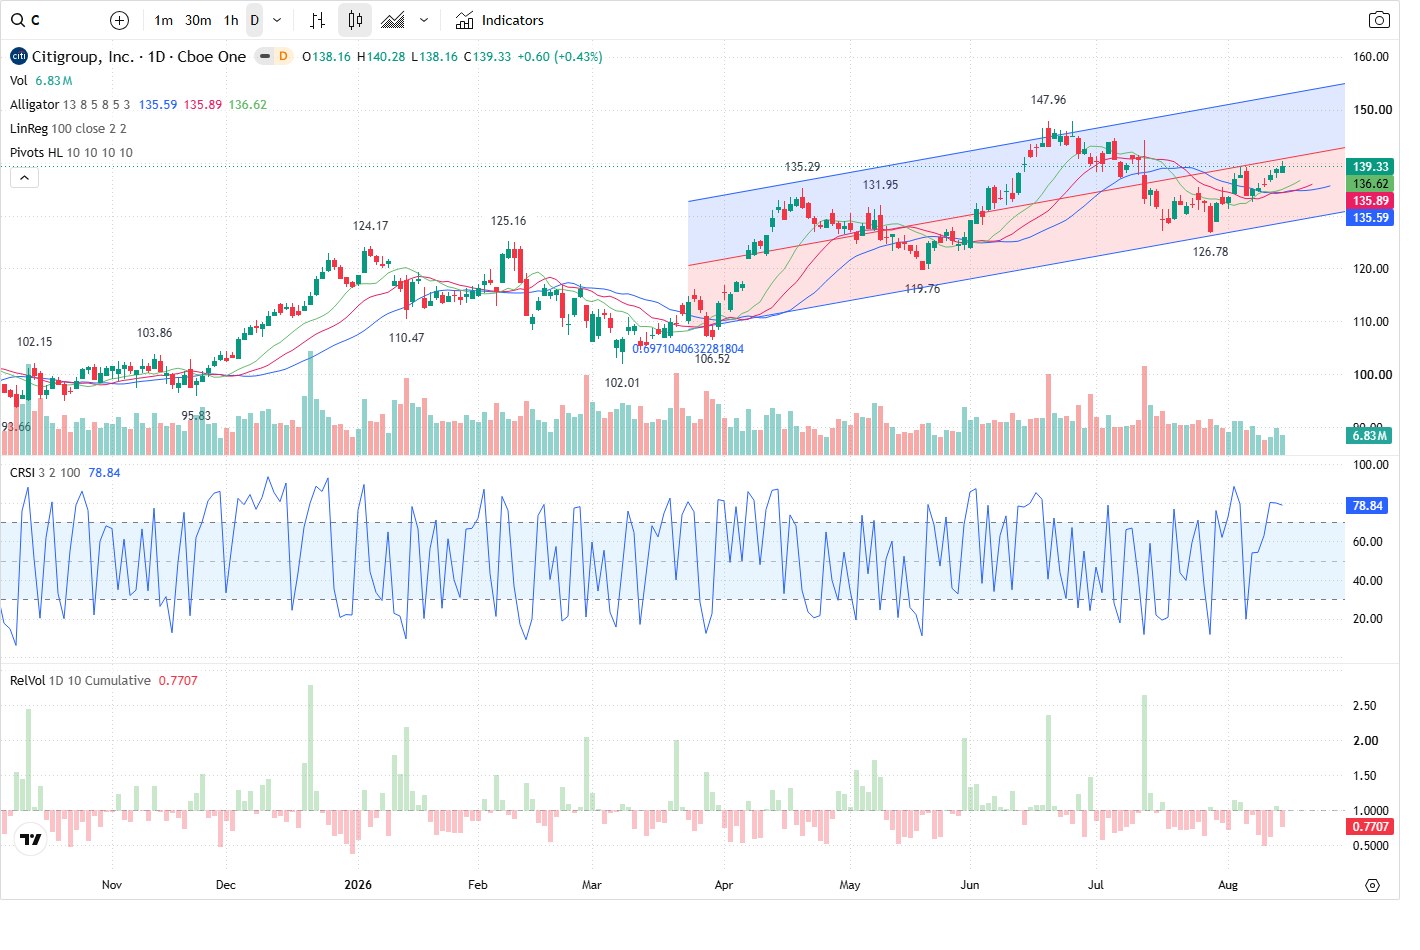
Citigroup (C) closed at 139.33, trading just above a high-volume node at 139.19. The Prediction Agent’s base case for the next session is mildly bullish: an early test of the 138.50–139.20 support zone is likely, and a sustained reclaim above 140.28 would be the key technical trigger for extension toward 144.28.
Technical picture (multi-timeframe)
The technical read is constructive but not emphatic. All three monitored timeframes show a bullish bias: 5m displays a HH/HL short-structure with price near short-term support, 60m is inside a rising channel, and the daily trend is up with price above corrective support. The Prediction Agent pins primary near-term support at 139.19 (zone 138.50–139.20) — a cluster made up of a session HVN and recent 5m/60m reaction area — and immediate resistance at the session high 140.28 (zone 140.00–141.00). The model’s most likely path is an early test of the support zone; if it holds, expect a drift or push toward the 140.00–140.28 area.
Volume and money flow
Volume is subdued overall: RVOL ~0.75 and the 5-day comparison shows a modest pickup versus the most recent 5d average (+14.7%) but below the 20d average (-24.6%). VFI remains above zero but is falling (current 3.459), indicating positive but weakening volume-based demand, while MFI is bullish at ~61. Directional prints show a net sell imbalance of -17,496 shares (buyers 73,943 vs sellers 91,439) and the capital-flow sample is net negative (net outflow ≈ -2.43m). In short, technicals are bullish but participation and large-order flow are mildly tilted to sellers — the Prediction Agent therefore requires a volume-confirmed reclaim of 140.28 to endorse a breakout.
Options and positioning
Options positioning supports the resistance near 140. The 8/21 140 strike shows the heaviest recent call volume and call OI (call volume 1,373; call OI 12,903) and the largest call open interest across strikes sits at the 150 strike (OI 15,338). Put OI is concentrated around 130. The model interprets the 140 strike activity as option-related supply that reinforces the immediate resistance band around 140.00–140.28; that concentration increases the importance of volume confirmation on any break above 140.28.
What’s driving the read
No company-specific news was available in the packet. The technical and flow read is therefore the main driver: price sitting on a short-term HVN (POC 132.17 further below), inside a rising 60m channel, with muted overall volume and net capital outflows. The Prediction Agent assigns probabilities of 50% bullish, 30% range, and 20% bearish and flags event risk as LOW — so the next session’s direction will depend on execution around the 138.50–139.20 support and the 140.28 resistance.
Outlook
Base case (mild bullish): early session tests of 138.50–139.20 that hold lead to a push to 140.00–140.28; a sustained break and reclaim above 140.28 on increasing volume would open the path to 144.28. Bullish confirmation: sustained break/reclaim above 140.28 on higher volume (or a 60m/daily close above). Bearish invalidation: clean break and intraday close below 138.50 on rising selling volume, or failure to hold above 140.00 after a breakout attempt (long plan invalidated at a close below 139.00 per the agent’s stop). The model’s expected close is ~140.20 with an expected intraday range roughly 137.5–142.0.
This article was generated by automated AI agents synthesizing technical, volume/flow, options, and news data — no human analyst reviewed it before publication.
It is provided for informational and educational purposes only and does not constitute investment, financial, trading, or legal advice, nor a recommendation or solicitation to buy or sell any security. This article may discuss both a near-term (next trading session) outlook and a separate longer-horizon (multi-month) scenario; the longer-horizon discussion is a deliberately broad, illustrative range of possible outcomes based on currently available information, not a price target or forecast, and is inherently more uncertain the further into the future it looks. AI-generated analysis may be incomplete, outdated, or inaccurate, and any forecasts, levels, or trade ideas described are not guaranteed and may not occur. Past patterns do not predict future results. Trading and investing involve substantial risk, including the risk of loss of principal. Always conduct your own research and consult a licensed financial advisor before making any investment decision. This platform and its operators assume no liability for actions taken based on this content.
Reference price at generation: $139.33.