GOOGL setup: model flags mild bearish tilt into 341.23 VAL with 348–351 option wall as likely resistance
Prediction engine sees early weakness toward the 341.23 volume‑profile VAL; options and intraday structure make 348.25–351.75 the primary seller band — current stance: no new directional trade until confirmation.
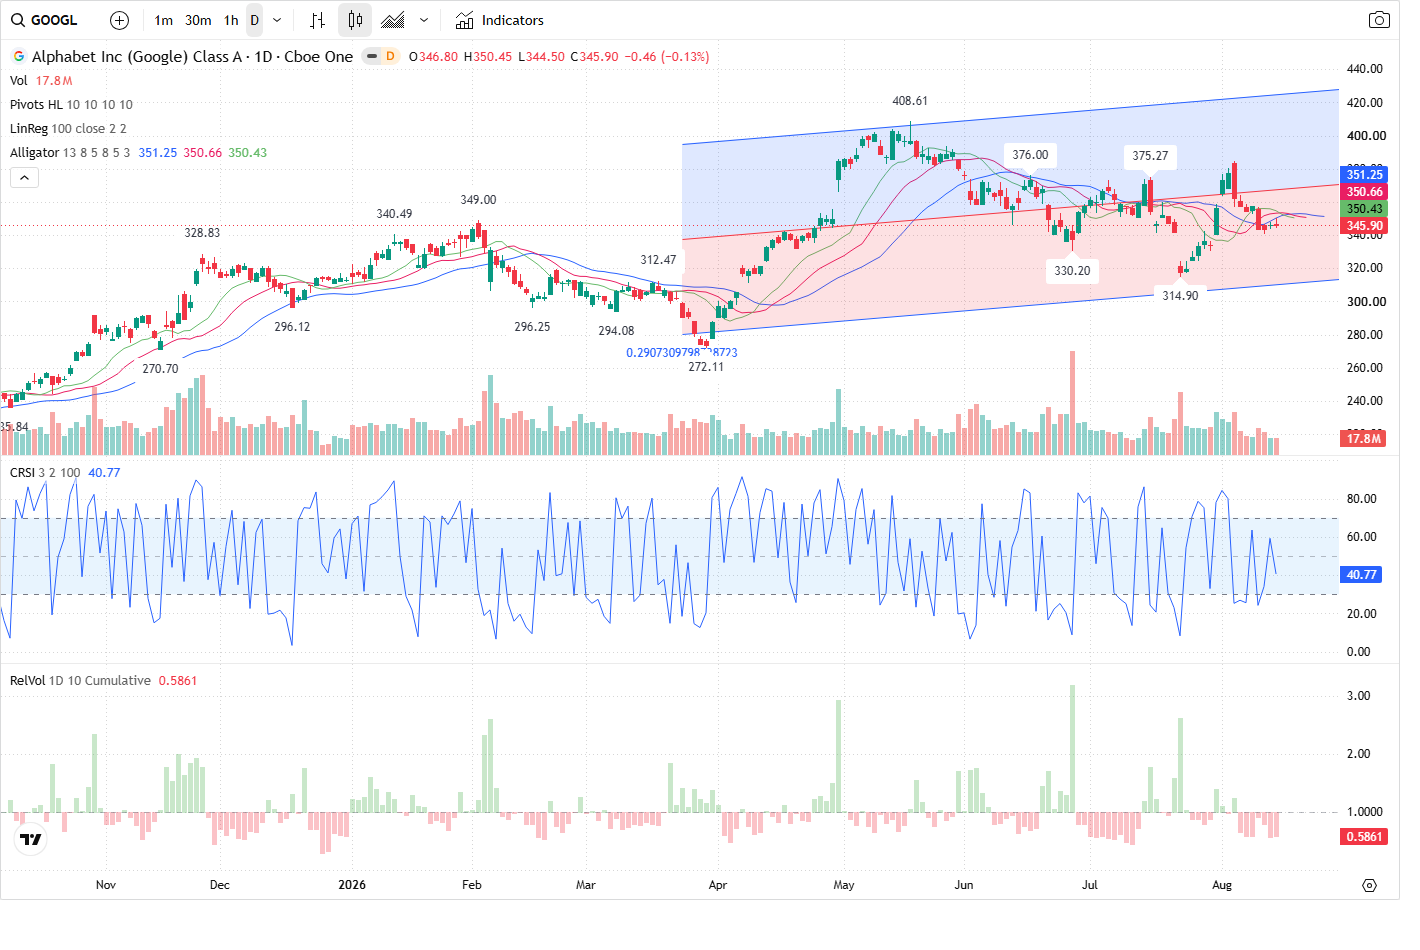
Alphabet (GOOGL) closed at 345.90 after a modest decline, and the model’s next‑session view is mild bearish (60% confidence): the most likely path is an early test of the 341.23 VAL / intraday support zone, with any rally expected to stall into the 348–351 option cluster.
Technical picture — multi‑timeframe mix
The technical engine describes a BEARISH_PULLBACK_REVERSAL setup that remains unconfirmed and is in a waiting_for_reversal state. Shorter intraday structure is defensive for sellers (5m trend SHORT; price below corrective resistance; nearest resistance 350.45 and nearest support 340.88). The 60m and daily remain LONG on their primary trend axes but show corrective short pressure: 60m structure is LH_LL with price at corrective support and an invalidation down at the 60m swing low 314.91; daily shows price above corrective support with an upper trendline near 357.77 and lower trendline near 323.57835443037976. The engine’s primary support is the volume‑profile VAL at 341.23333333333335 (zone 340.50–342.25) and primary resistance is 350.00 (zone 348.25–351.75).
Volume and capital flow — sellers present but participation weak
Volume regime is subdued: RVOL ~0.58 with current volume 16,520,653 below 5‑ and 20‑day averages. VFI is negative and falling (current -9.1359, trend falling and below zero) and directional flow shows sellers dominant (sell_pct 53.18; net imbalance -35,565). Capital flow data shows net outflow driven by large orders (net large flow -12,421,999.359999955). The model interprets this as seller skew without the participation required for a clean, high‑conviction move — supporting a cautious, no‑trade posture until a clear breakout or breakdown with expanding volume.
Options picture — a visible resistance band near 350
Short‑dated options (expiry 2026‑08‑21) concentrate open interest and volume around 350 and 360 strikes. Important strikes list a 350 call OI of 20,901 and large call volume at 360; major positioning zones are 348.25–351.75 (large call OI concentration) and 358.2–361.8 (large put OI concentration). The engine uses that options clustering to identify the 348–351 band as the likeliest seller defence if price attempts to rally from the 341 area.
Trade plan and risk management
Prediction probabilities: bearish 45%, range 30%, bullish 25% with prediction_confidence 60. The most likely path: early weakness tests the 341.23333333333335 VAL / 340.9 intraday support; limited buyer defense will produce a bounce toward 348–351 where resistance is expected. Bearish confirmation is a break and close below 340.50 on rising sell volume and worsening VFI — that would target the daily secondary support near 323.57835443037976. Bullish confirmation requires a sustained reclaim and close above 351.0 on above‑average buy volume (RVOL >1) and improving VFI, which would shift the thesis toward 359.330625. Current trade_idea is NO_TRADE (conviction LOW): reversal is unconfirmed, volume is muted, and participation does not validate initiating a directional position.
Outlook
Most likely next session is mild bearish: expect an early probe of the 341.23 VAL (zone 340.50–342.25) with potential mean reversion into the 348–351 option cluster that is likely to act as seller defence. Confirmation for a bearish continuation would be a decisive close below 340.50 with expanding selling volume and a deeper negative VFI; a decisive reclaim and close above 351.0 on expanding buy volume would invalidate the no‑trade stance and open a bullish target toward 359.330625. Given low participation and an unconfirmed reversal, the model recommends waiting for one of these confirmations before taking a directional trade.
This article was generated by automated AI agents synthesizing technical, volume/flow, options, and news data — no human analyst reviewed it before publication.
It is provided for informational and educational purposes only and does not constitute investment, financial, trading, or legal advice, nor a recommendation or solicitation to buy or sell any security. This article may discuss both a near-term (next trading session) outlook and a separate longer-horizon (multi-month) scenario; the longer-horizon discussion is a deliberately broad, illustrative range of possible outcomes based on currently available information, not a price target or forecast, and is inherently more uncertain the further into the future it looks. AI-generated analysis may be incomplete, outdated, or inaccurate, and any forecasts, levels, or trade ideas described are not guaranteed and may not occur. Past patterns do not predict future results. Trading and investing involve substantial risk, including the risk of loss of principal. Always conduct your own research and consult a licensed financial advisor before making any investment decision. This platform and its operators assume no liability for actions taken based on this content.
Reference price at generation: $345.90.