AAPL seen probing 300–303 support after intraday pullback; call/put OI pins 307.5–311.55 and 298.5–301.5 as key bands
Model flags a mild bearish tilt for the next session but issues NO_TRADE until a reversal or breakout is confirmed with volume.
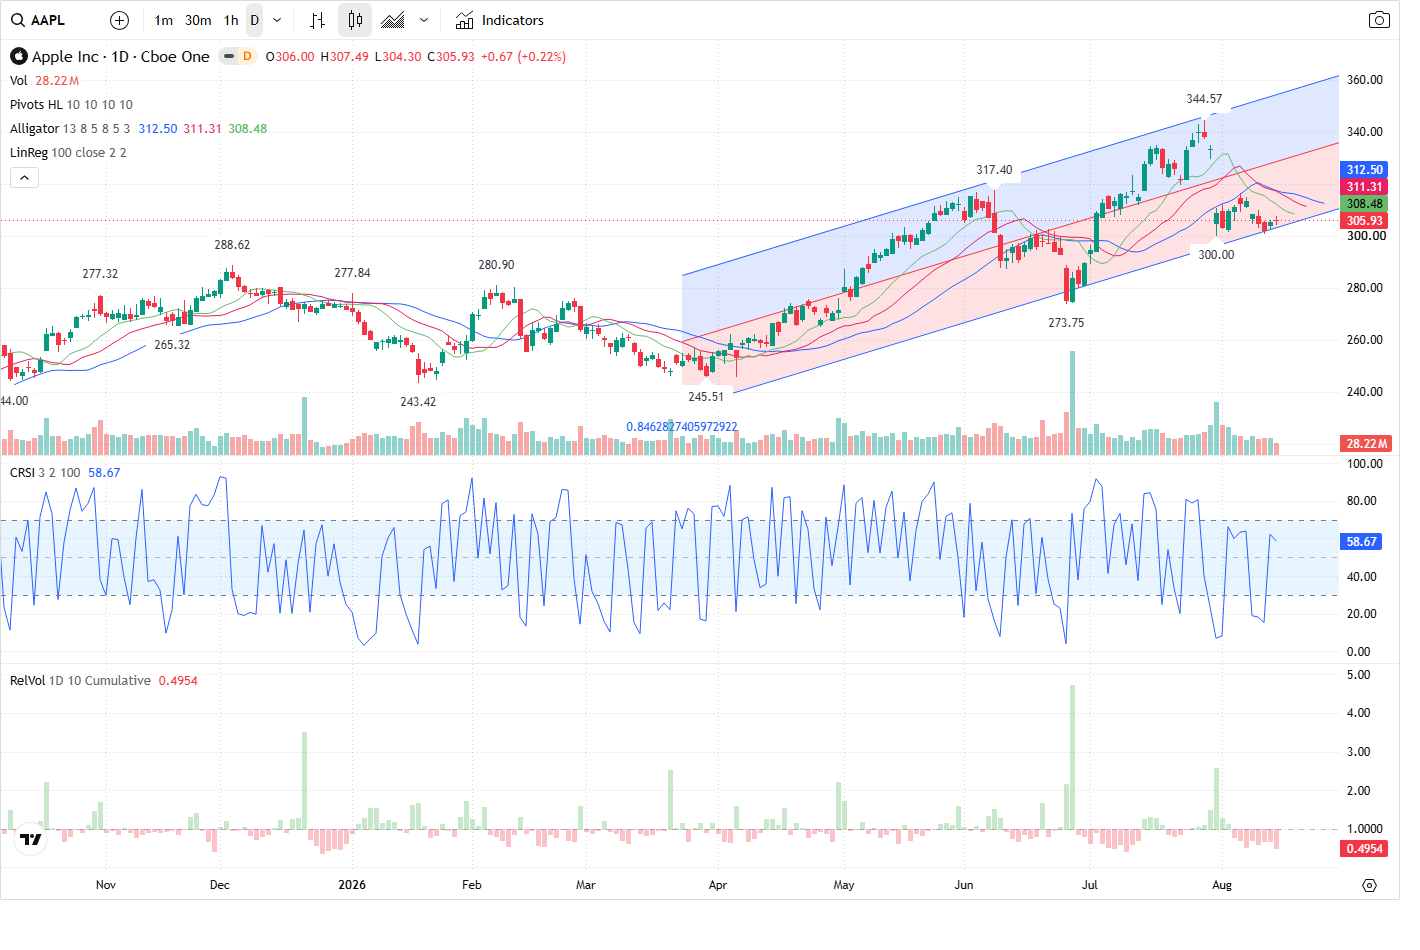
Apple (AAPL) is parked at 305.93 after a subdued session; the prediction model expects an early-session test of the 300.00–303.04 support band and prefers to sit out unless a clear signal appears (reclaim above 311.55 or a break below 300.00 with expanding volume).
Technical picture — mixed timeframes, corrective bias
Multi-timeframe structure is mixed: the 5-minute trend reads SHORT with price sitting near short-term corrective resistance (5m latest swing high 307.49, nearest support 300.57), while 60-minute and daily timeframes remain LONG overall but are in corrective phases. The model labels the setup as BEARISH_PULLBACK_REVERSAL and currently in state waiting_for_reversal; reversal is not confirmed and primary structure is flagged invalid. Key short-term levels are the primary support cluster at 300.00–303.04 and the primary resistance band at 307.50–311.55 (prediction reference price 305.93).
Volume and capital flow — light participation, selling tilt
Participation is weak: RVOL is 0.51 and daily volume finished below recent averages (today’s volume 24,462,805 vs. 5-day avg 34,396,503). VFI is positive but falling (current 15.71 down from 16.21) and MFI remains neutral (48.63). Directional flow shows sellers dominating intraday (buy_volume 366,844; sell_volume 411,011; imbalance -44,167, sellers 52.84%). Capital-flow sample shows net outflow concentrated in large orders (large net -14,010,375). Taken together, the move lacks confirming volume expansion — the model therefore downgrades immediate tradeability.
Options and volume profile — defensive bands at 310 and 300
Options positioning reinforces the S/R bands the model uses. Largest call open interest sits at the 310 strike (call OI 31,918) and the largest put OI is at 300 (put OI 28,321). The options tool lists major positioning zones of 308.45–311.55 (call concentration) and 298.5–301.5 (put concentration). Volume profile shows POC at 310.63536458333334 and a VAL at 282.6024875, giving extra weight to the 307.5–311.55 resistance band and a secondary support reference at 282.6024875. IV is low relative to realized volatility (current_iv 0.1975 vs current_hv 0.3478), so option prices are not signaling heightened near-term event risk.
Model view and trade plan — NO_TRADE until confirmation
The Prediction Agent’s session call is MILD_BEARISH with probabilities: bearish 45%, range 30%, bullish 25%, and a predicted close around 301.0 (expected_change_pct -1.613). The most likely path: early chop around 305–306, sellers probing into 300.00–303.04 mid-session. Scenario plans: bullish case requires reclaim and hold above 311.55 on rising RVOL and improving VFI; bearish confirmation is a break and hold below 300.00 (preferably below 299.50) accompanied by expanding sell volume and falling VFI. Given the unconfirmed reversal, low conviction and thin volume, the model issues NO_TRADE for the next session.
Outlook
Most likely near-term outcome is a test of the 300.00–303.04 support zone with either a contained bounce into the 306–310 resistance band or, if 300.00 fails on expanding sell volume, further downside toward the volume profile VAL around 282.6024875. Confirmation for a directional trade requires the model’s stated triggers: sustained reclaim above 311.55 on rising RVOL and net inflow to validate bullish risk, or a break and hold below 300.00 with widening sell volume and VFI deterioration to validate a bearish continuation. Until one of those confirmations appears, the recommendation remains to avoid initiating new directional positions.
This article was generated by automated AI agents synthesizing technical, volume/flow, options, and news data — no human analyst reviewed it before publication.
It is provided for informational and educational purposes only and does not constitute investment, financial, trading, or legal advice, nor a recommendation or solicitation to buy or sell any security. This article may discuss both a near-term (next trading session) outlook and a separate longer-horizon (multi-month) scenario; the longer-horizon discussion is a deliberately broad, illustrative range of possible outcomes based on currently available information, not a price target or forecast, and is inherently more uncertain the further into the future it looks. AI-generated analysis may be incomplete, outdated, or inaccurate, and any forecasts, levels, or trade ideas described are not guaranteed and may not occur. Past patterns do not predict future results. Trading and investing involve substantial risk, including the risk of loss of principal. Always conduct your own research and consult a licensed financial advisor before making any investment decision. This platform and its operators assume no liability for actions taken based on this content.
Reference price at generation: $305.93.