SPY sits on 773.45 HVN support; model favors mild bullish drift into 780 call‑OI wall — but volume and order flow keep conviction low
Prediction: a next‑session retest of the nearby high‑volume node at 773.45 with a probable push toward the 780 call‑OI resistance unless sellers expand volume on a break below 772.50.
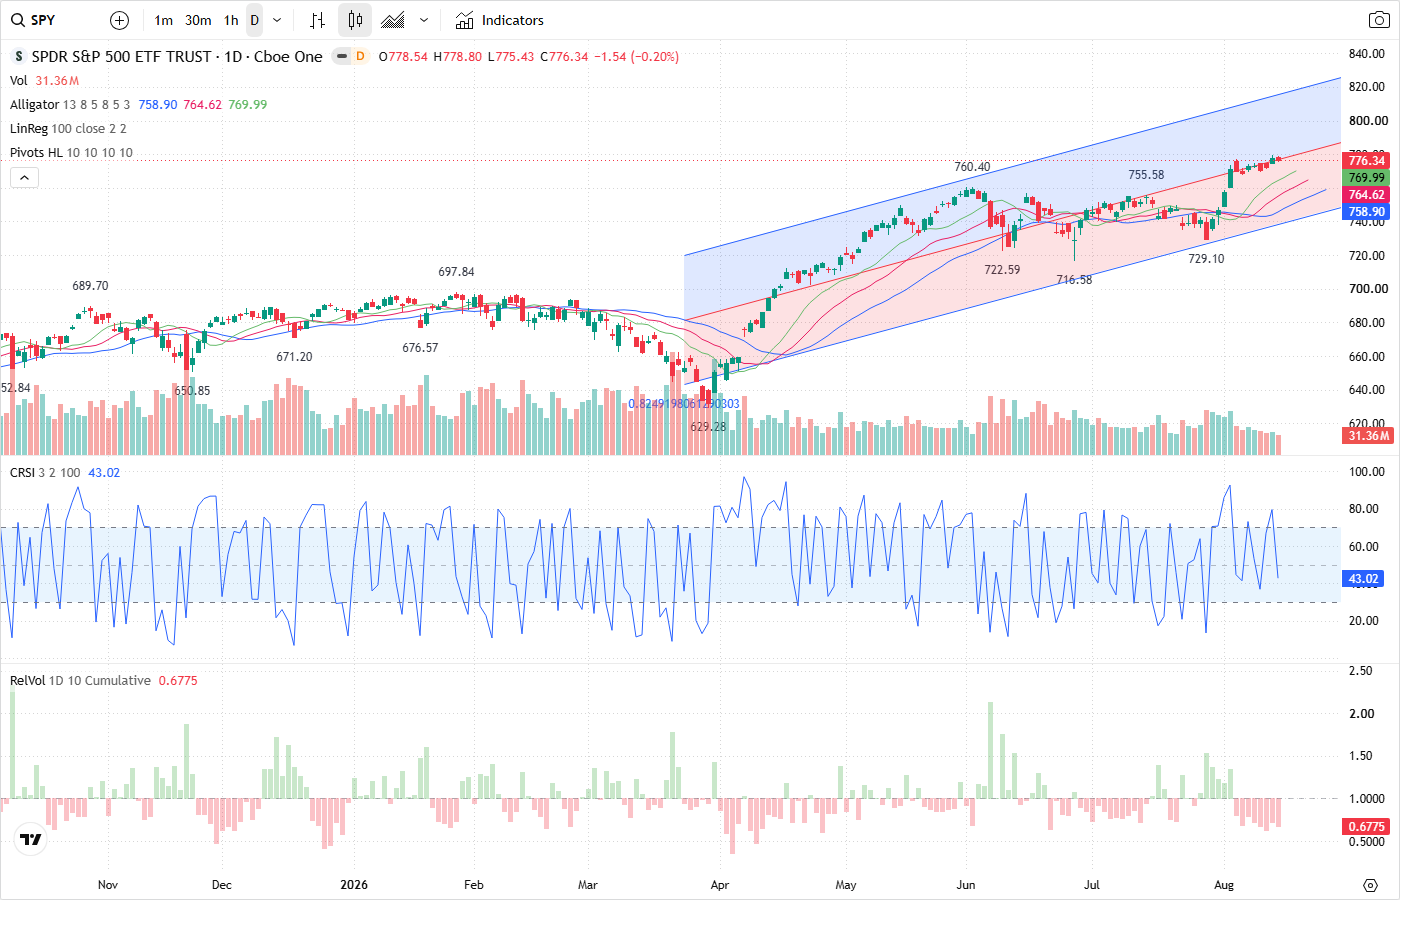
SPY closed at 776.34, trading just above a high‑volume node at 773.4554 and inside a short‑term corrective pullback. The next session’s key event is whether buyers defend the 772.5–774.5 support zone; a defended HVN should let price drift toward the concentrated call open interest around 780.00.
Technical picture — multi‑timeframe bias is bullish but reversal is unconfirmed
The prediction model labels the overall trend as mildly bullish with daily and 60‑minute trends remaining long while a short‑term corrective trend is active. 5‑minute structure is mixed and the detected bullish pullback reversal remains in state “waiting_for_reversal” — reversal not confirmed. Primary near‑term support is the HVN at 773.4554166666667 (zone 772.5–774.5) located almost at today's price; primary resistance is the options‑backed shelf at 780.00 (zone 778.5–783.9). The secondary support/POC sits at 749.7970833333334 while the broader channel on the 60m/day charts still favors higher highs absent a structural breakdown.
Volume and money flow — participation is weak and order flow favours sellers
On‑session relative volume is subdued (RVOL ~0.59) and daily volume has been below the 5/20‑day averages. VFI is positive and rising (current 1.7366, up from 1.4925), and MFI remains in bullish territory (current 67.1346) — signs of underlying demand. However directional metrics show a net seller imbalance: buy_volume 520,903 vs sell_volume 601,007 (imbalance -80,104, -7.14%) and recent capital flow for large players is negative (net ~-62,147,440.88). The combination of light total volume with a seller‑biased order flow weakens conviction for an immediate breakout higher.
Options positioning — a call‑OI wall near 780 creates clear resistance
Options data show concentrated call open interest at 780.0 (largest_call_oi_strike 780.0) and a major call positioning zone from 776.1 to 783.9. Put OI clusters lower around 750.0 (largest_put_oi_strike 750.0) and the POC/secondary support is 749.7970833333334. Near‑term option volumes show elevated put trades at strikes like 760 and 770 for the upcoming weekly expiry, and the put/call volume ratio is ~1.13 — slightly elevated put activity intraday — while the OI put/call ratio remains <1 (0.8383). In short: options structure supports a cap near 780 and deeper support nearer 750 if sellers take control.
Session trade plan — scenarios and confirmations
Model probabilities: bullish 45%, range 35%, bearish 20% (prediction_confidence 60). Bullish scenario: if price holds the 773.45 HVN zone (772.5–774.5) and rebounds with improving volume, expect a push to 780.00; a sustained close above 780.00 on rising volume targets the 783.90 zone. Range scenario: if neither edge breaks decisively, expect chopping between ~772.5 and ~780.0. Bearish scenario: a clear break and close below 772.50 on expanding selling volume would point toward the POC/secondary support at 749.7970833333334. The model’s bullish confirmation requires a sustained intraday trade and close above 780.00 with rising volume and improving VFI/MFI; bearish confirmation is a close below 772.50 on expanding selling volume and negative large‑order net flow. Given the lack of reversal confirmation and weak participation, the prediction agent recommends NO_TRADE for the next session (trade_idea.direction = NO_TRADE, conviction LOW).
Outlook
Most likely near‑term path is an early retest of the 773.4554 HVN (zone 772.5–774.5). If buyers defend that area, price should drift toward the 778.5–780.0 resistance band and test the concentrated call‑OI at 780.00 (expected_close ~780.96; expected_move up ~0.59%). If volume and VFI/MFI pick up on a reclaim above 780.00 the setup would gain tradable conviction; conversely, an expanding sell volume close below 772.50 would invalidate the mild bullish view and open a run toward the 749.7970833333334 POC.
This article was generated by automated AI agents synthesizing technical, volume/flow, options, and news data — no human analyst reviewed it before publication.
It is provided for informational and educational purposes only and does not constitute investment, financial, trading, or legal advice, nor a recommendation or solicitation to buy or sell any security. This article may discuss both a near-term (next trading session) outlook and a separate longer-horizon (multi-month) scenario; the longer-horizon discussion is a deliberately broad, illustrative range of possible outcomes based on currently available information, not a price target or forecast, and is inherently more uncertain the further into the future it looks. AI-generated analysis may be incomplete, outdated, or inaccurate, and any forecasts, levels, or trade ideas described are not guaranteed and may not occur. Past patterns do not predict future results. Trading and investing involve substantial risk, including the risk of loss of principal. Always conduct your own research and consult a licensed financial advisor before making any investment decision. This platform and its operators assume no liability for actions taken based on this content.
Reference price at generation: $776.34.