QQQ eyeing POC support at 717.64; model sees mild bullish tilt but recommends no trade into FOMC minutes
Prediction model expects an intraday test of the 715–718 support cluster with a likely probe up toward the 738–741 VAH area — but low R:R and medium event risk keep the call as NO_TRADE for the next session.
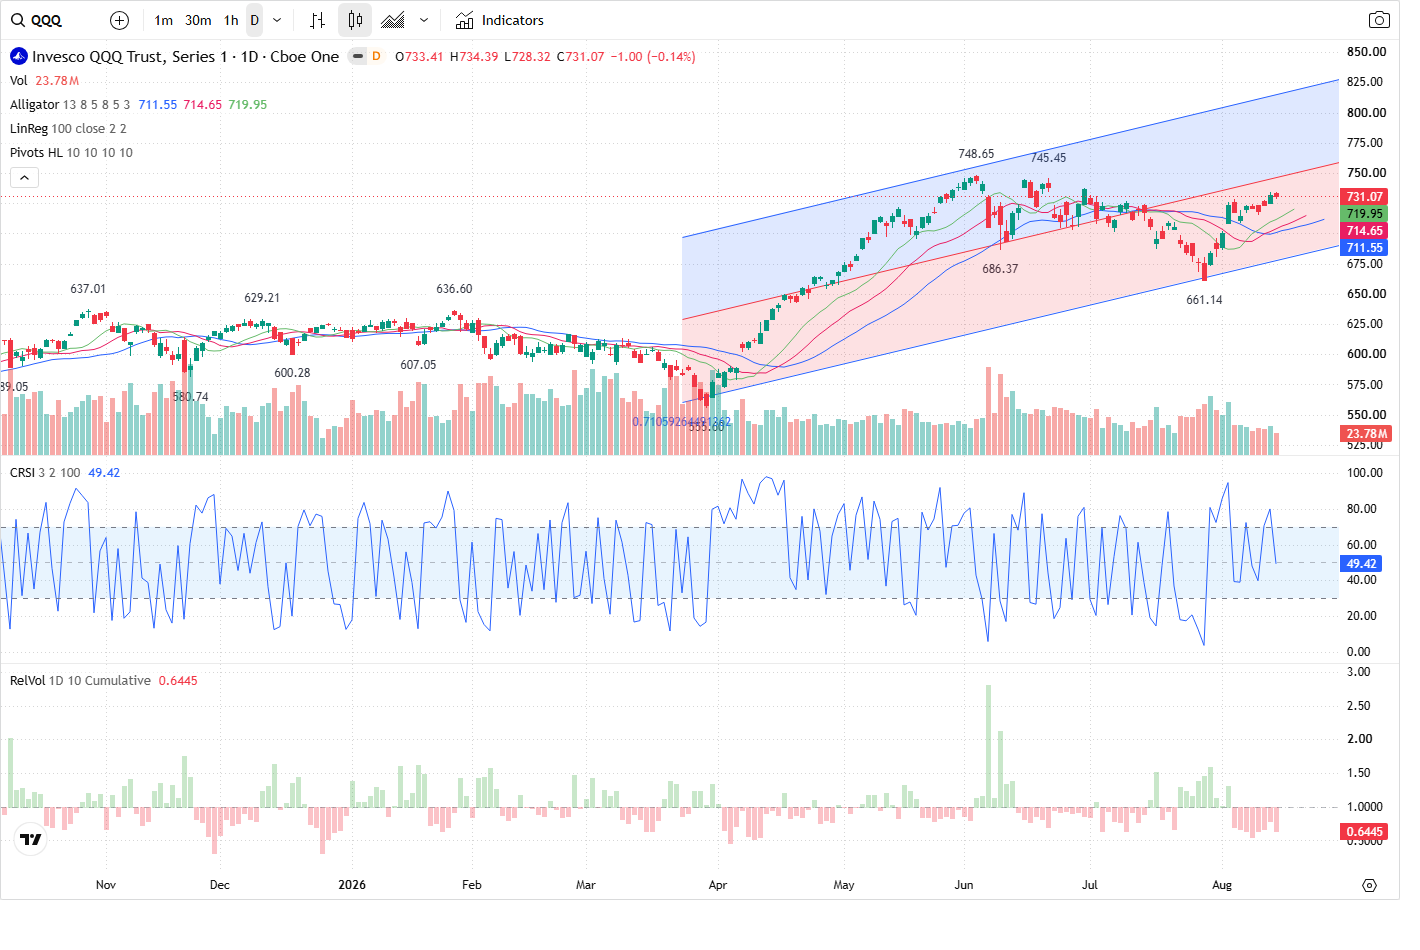
QQQ closed at 731.07 after a modest pullback; the Prediction Agent expects next-session price action to first test the volume‑profile POC and 5‑minute reaction lows around 717.64–715.0 before a potential drift back toward the 738–741 resistance zone. Given muted participation and upcoming FOMC minutes/Core PCE risk, the model labels the outlook mild bullish but does not recommend taking a fresh trade today.
Technical picture — aligned uptrend with an active corrective leg
All three timeframes (5m, 60m, 1d) remain classified LONG by the model, but a short-term corrective trend is active. On the 5‑minute chart the structure is HH_HL with corrective action testing intraday support (nearest_support 728.32, 5m invalidation 728.32). The 60‑minute view shows price near corrective support inside an upward channel (nearest_resistance 745.43). On the daily, the up channel remains intact with the latest swing high at 748.63 and the corrective short still in place. Key structural levels cluster into the support zone centered on the volume‑profile POC at 717.6439583333333 (zone 715.0–718.5) and a resistance band near the VAH at 741.3391666666666 (zone 738.5–742.5).
Volume, order flow and participation
Participation is muted versus recent sessions: current RVOL is 0.5939966420766002 and today's volume (21,262,027) sits below short-term averages. Despite lower absolute volume, internal flow favors buyers — directional readings show buy_pct 65.58 with an imbalance of 407,754 and VFI rising (current 4.034462480884353). MFI is bullish and climbing (current 70.73831550333631). The model reads this as buyer‑dominated order flow around the POC, offering support to the bullish tilt but noting the limited breadth of participation.
Options and volatility context
Options positioning reinforces the resistance band near 740–741: total_call_volume (70,842) vs put_volume (47,247) and a concentrated call volume/open interest cluster at the 730–740 region makes the VAH area a meaningful supply zone. Important strikes show heavy put OI at 680/700 and heavy call volume and OI at 730/740; the model flags the VAH (741.3391666666666) as the nearest meaningful supply. Implied volatility is low relative to realized (current_iv 0.1406 vs current_hv 0.23642012710577873), reducing option‑priced skew but leaving event‑driven realized moves possible.
Event risk and the trade stance
Event risk is rated MEDIUM due to FOMC minutes and Core PCE on the calendar; the Prediction Agent highlights these as potential volatility catalysts that could rapidly change intraday structure. Combining muted RVOL, buyer‑leaning flow, concentrated option interest near 740–741 and the upcoming macro releases, the model assigns a MILD_BULLISH tilt (prediction_confidence 70) but recommends NO_TRADE for the next session. The rationale: available short‑horizon levels offer poor reward relative to stop placement and medium event risk, producing LOW conviction for an actionable entry.
Outlook
Most likely path: early‑session tests of the 717–718 support cluster (POC and 5m reaction lows); if buyers defend that area and selling volume declines, price should drift toward 738–741 (VAH and option concentration). Bullish confirmation is defined as a sustained reclaim above 735.0 for 30 minutes with neutral‑to‑rising large‑order flow; bearish confirmation is a break and hold below 715.0 on expanding sell volume targeting the secondary support at 701.2395833333333. Given muted participation and medium event risk, the model will stay sidelined until either a clean reclaim above 735 or a confirmed break below 715 provides a defensible R:R.
This article was generated by automated AI agents synthesizing technical, volume/flow, options, and news data — no human analyst reviewed it before publication.
It is provided for informational and educational purposes only and does not constitute investment, financial, trading, or legal advice, nor a recommendation or solicitation to buy or sell any security. This article may discuss both a near-term (next trading session) outlook and a separate longer-horizon (multi-month) scenario; the longer-horizon discussion is a deliberately broad, illustrative range of possible outcomes based on currently available information, not a price target or forecast, and is inherently more uncertain the further into the future it looks. AI-generated analysis may be incomplete, outdated, or inaccurate, and any forecasts, levels, or trade ideas described are not guaranteed and may not occur. Past patterns do not predict future results. Trading and investing involve substantial risk, including the risk of loss of principal. Always conduct your own research and consult a licensed financial advisor before making any investment decision. This platform and its operators assume no liability for actions taken based on this content.
Reference price at generation: $732.07.