NVDA set to test 223 zone before potential push toward 230; model stays cautious amid weak participation
Prediction model sees a mild bullish session for NVDA with an early dip toward 223.0–222.0 then a recovery into the 227–230 resistance band — but recommends no fresh trade until volume or flow confirms.
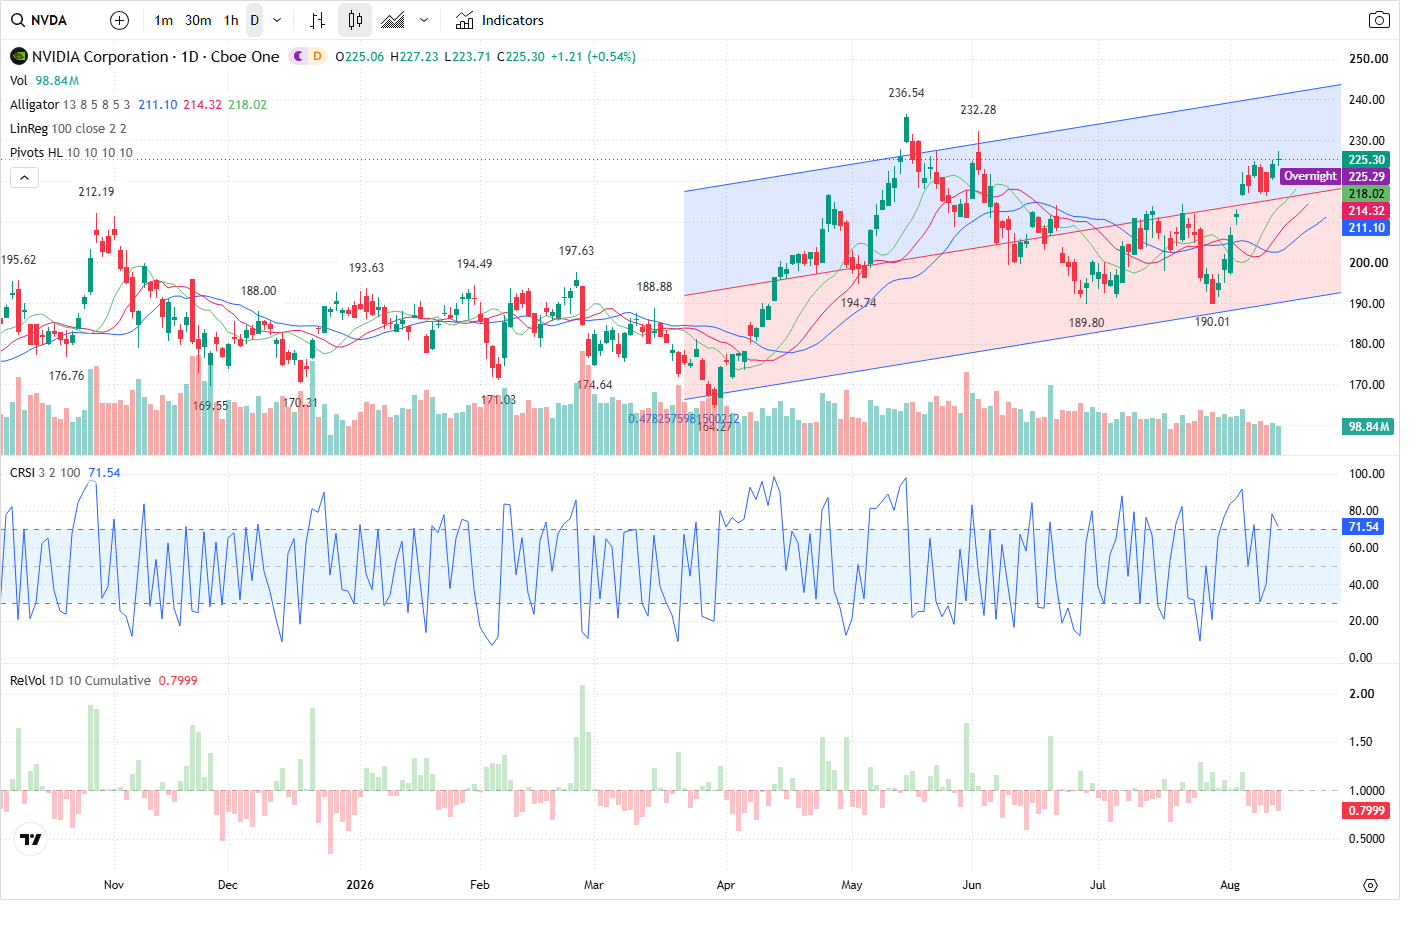
NVIDIA (NVDA) is trading at 225.30 in the premarket with the model calling a mild bullish bias for the next session. The single most important price action to watch is the 223.13 support area (222.00–224.50 zone): a defended test there is the trigger the model wants to see before committing to a directional trade.
Technical picture — multi-timeframe bullish, correction still active
The Prediction Agent classifies the multi-timeframe trend as bullish (5m, 60m and daily all show LONG trend strength 100%). Intraday structure on the 5-minute chart is HH_HL with a corrective short present; the flagged intraday swing low/invalidation on 5m is 222.23. The 60-minute lower trendline converges near 223.13, which the model lists as primary support (zone 222.00–224.50). Primary resistance is concentrated around 230.00 (zone 227.00–231.50) — driven by the 5m intraday highs near 227.23 and the option positioning cluster around 230. Daily structure shows price above daily corrective support with a higher daily swing high at 236.54 noted as secondary resistance.
Volume and order-flow — mixed signals, participation currently weak
Volume is below recent averages: RVOL ~0.79 (current volume 91,097,990 vs 5d avg 100,032,626), and the short-term volume trend is decreasing. Indicators show improving internal demand — VFI is rising and now 2.097 (above zero) and MFI is bullish at 64.26 — but tape-level directional flow is dominated by sellers (buy_pct 16.05 / sell_pct 83.95, net imbalance -8,061,796). The model highlights this split: indicator-based breadth looks constructive while large-order flow is negative, so participation needed to carry a breakout is not yet present.
Options & volatility — call-skewed positioning creates near-term cap
Options activity is strongly call-skewed: total_call_volume 137,347 vs put volume 48,811 and OI ratios (oi_put_call_ratio ~0.329) reflect call concentration. The largest call open interest is at the 230 strike (large call OI at 230 and a positioning zone 228.85–231.15). That cluster lines up with the model's primary resistance zone (227.00–231.50). IV sits near 32.33% versus realized vol ~39.45% (IV_HV_SPREAD -0.0712, IV_HV_RATIO 0.819), indicating option premiums are modest relative to recent realized movement.
Session trade plan — scenarios and confirmations
The Prediction Agent's base-case path: an early dip toward the 223.0–222.0 support zone testing the 60m lower trendline/5m swing low, then a buyer defence that recovers price through 225–227 and into the 227–230 resistance band; the model's expected close is 229.8 (+1.99%). Bullish confirmation requires a sustained reclaim above 227.00 accompanied by rising RVOL above 1.0 and improving large-order net flow. Bearish confirmation would be a break and hold below 222.00 on expanding sell volume, which the model says would open a run to the secondary support around 216.35. Given the unconfirmed reversal and mixed participation, the trade idea is NO_TRADE for the next session (conviction LOW) — the model prefers to wait for either the reclaim above 227 with stronger volume or a clear defend of 223 with improving flow.
Outlook
Most likely near-term path is the model’s mild bullish base case: a test of the 223.13 support area followed by a recovery into 227–230, with a projected close near 229.8 (+~2%). Confirmation hinges on improving participation — rising RVOL (>1.0) and a reduction in the large-order sell imbalance for a credible upside. Conversely, a decisive, volume-backed break below 222.00 would invalidate the mild-bull case and point toward the 216.35 volume-node support.
This article was generated by automated AI agents synthesizing technical, volume/flow, options, and news data — no human analyst reviewed it before publication.
It is provided for informational and educational purposes only and does not constitute investment, financial, trading, or legal advice, nor a recommendation or solicitation to buy or sell any security. This article may discuss both a near-term (next trading session) outlook and a separate longer-horizon (multi-month) scenario; the longer-horizon discussion is a deliberately broad, illustrative range of possible outcomes based on currently available information, not a price target or forecast, and is inherently more uncertain the further into the future it looks. AI-generated analysis may be incomplete, outdated, or inaccurate, and any forecasts, levels, or trade ideas described are not guaranteed and may not occur. Past patterns do not predict future results. Trading and investing involve substantial risk, including the risk of loss of principal. Always conduct your own research and consult a licensed financial advisor before making any investment decision. This platform and its operators assume no liability for actions taken based on this content.
Reference price at generation: $225.30.